Android vs iOS Market Share: Quick Answers
The questions people type most, answered with the newest figure we could confirm on November 13, 2026. Usage share comes from Statcounter, which counts page views on websites, so it describes phones in use. Sales share comes from Counterpoint Research, which counts phones sold in a quarter. The two answer different questions, and both are here.
| Question | Answer | Source and date |
|---|---|---|
| What is the Android vs iOS market share worldwide? | Android 72.36%, iOS 27.61% of mobile web use | Statcounter, worldwide, October 2026 |
| What is the iPhone vs Android market share in the US? | iOS 51.96%, Android 48.02% of mobile web use; iOS 51% of smartphone sales | Statcounter, United States, October 2026, and Counterpoint, second quarter of 2026 |
| What share of new smartphones sold run iOS? | 20% worldwide, against Android 75% and HarmonyOS 5% | Counterpoint, second quarter of 2026, published August 31, 2026 |
| What share of phones shipped were iPhones in the latest quarter? | 22.4% (57.3 million of 255.3 million) | IDC, third quarter of 2026, preliminary, October 14, 2026 |
| Which countries have more iPhones than Android phones? | Canada 64.74%, Australia 62.09%, Japan 53.8%, United States 51.96%, United Kingdom 50.14% | Statcounter country pages, October 2026 |
| Which country is the most Android heavy of the big markets? | India, at 94.84% Android | Statcounter, India, October 2026 |
| How many apps are on Google Play? | 2,696,134 by 42matters; 2,090,391 by AppBrain | 42matters, November 13, 2026, and AppBrain, November 12, 2026 |
| Which Android version is used most? | Android 16, on 25.4% of devices by Google's count and 37.71% of Android web use by Statcounter's | Google's Android Studio distribution data, October 1, 2026, and Statcounter, October 2026 |
| Which store earns more? | The App Store: 1.75 times Google Play's mobile game revenue in 2025, on about a fifth of its game downloads | Sensor Tower, State of Gaming 2026, with dollar figures as reported by 9to5Mac |
Statcounter percentages are for one month and move from month to month, sometimes by several points. The country table further down adds a 12 month average next to each October figure, so you can see which numbers are steady and which ones jumped.
Android vs iOS Market Share in 2026: The Short Version
Android runs most of the world's phones. iOS runs most of the money. That is the whole story in two sentences, and almost every number on this page is a variation of it. Statcounter puts Android at 72.36% of mobile web use worldwide in October 2026 and iOS at 27.61%. Counterpoint puts iOS at 20% of smartphones sold worldwide in the second quarter of 2026, its highest share for that quarter on record. And in mobile games, where the store split is published, Sensor Tower says the App Store earned 75% more in 2025 than Google Play while Google Play logged more than four times the downloads.
The world average hides the part most app makers care about. In the richest app markets the iPhone is level with Android or ahead of it. Statcounter has iOS at 51.96% in the United States, 64.74% in Canada, 62.09% in Australia, 53.8% in Japan and 50.14% in the United Kingdom. Go to India, Indonesia or Brazil and Android has between 73% and 95% of mobile web use. So "which one has more users" has a different answer depending on where your users live.
There are three ways to measure share, and people mix them up constantly. Usage share counts phones in use, usually through web traffic. Sales share counts phones sold in a period, which swings with launch season. Store share counts downloads or money spent in each app store. A headline that says iOS has 20% and another that says iOS has 58% can both be right: the first is worldwide sales in a quarter, the second is United States usage across a year.
If you only remember one rule from this page, make it this one: pick the measure that matches your decision. Deciding which phone to test on first? Use usage share in your target country. Forecasting revenue? Use store spending. Planning a launch around a new phone? Use sales. The App Store statistics page covers Apple's own store numbers in depth; this page is about the split between the two platforms.
Android vs iOS Market Share by Country
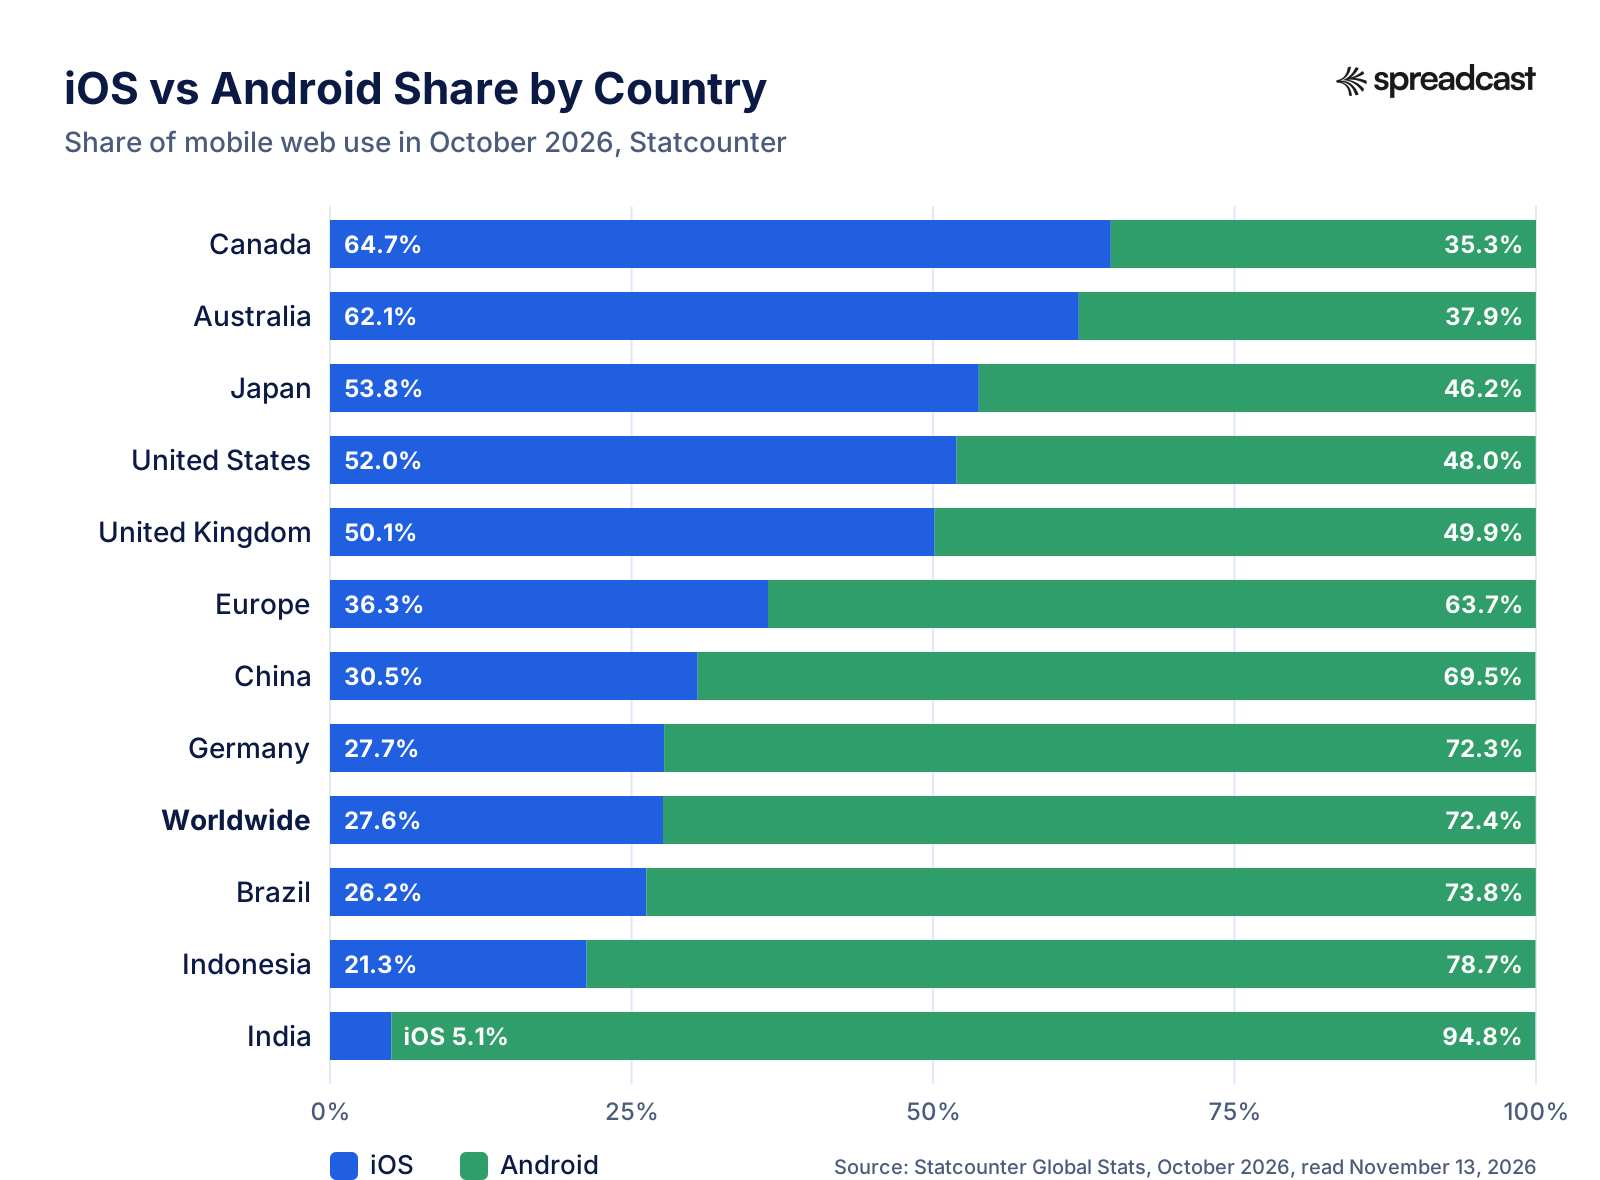
Twelve markets people search for most, sorted by iOS share. The October 2026 columns are the figures Statcounter shows on each country page. The 12 month average is ours, derived from Statcounter's monthly data for November 2025 to October 2026, downloaded on November 13, 2026. When the two columns are far apart, the October figure is a swing, not a trend.
| Market | iOS, October 2026 | Android, October 2026 | iOS, 12 month average (derived) | Who leads |
|---|---|---|---|---|
| Canada | 64.74% | 35.26% | 63.80% | iOS, clearly |
| Australia | 62.09% | 37.9% | 61.64% | iOS, clearly |
| Japan | 53.8% | 46.18% | 60.86% | iOS |
| United States | 51.96% | 48.02% | 59.22% | iOS |
| United Kingdom | 50.14% | 49.85% | 50.49% | Level |
| Europe | 36.32% | 63.67% | 38.73% | Android |
| China | 30.49% | 69.46% | 27.64% | Android, with HarmonyOS inside it (see below) |
| Germany | 27.7% | 72.29% | 36.63% | Android |
| Worldwide | 27.61% | 72.36% | 30.53% | Android |
| Brazil | 26.23% | 73.76% | 20.39% | Android, clearly |
| Indonesia | 21.28% | 78.68% | 18.00% | Android, clearly |
| India | 5.1% | 94.84% | 5.87% | Android, almost entirely |
The two shares in a row add up to a little under 100% because Statcounter also lists Samsung's own browser platform, KaiOS, Linux and other systems with tiny shares. Three markets moved a lot during the year: the United States and Japan had higher iOS shares for most of the year than in October, and Germany's iOS share fell from above 39% in June to under 28% from August onward, a drop large enough that we would treat it as a change in the measurement until a few more months confirm it.
Chart: iOS vs Android Share by Country in October 2026
The same twelve markets as bars. Everything above the United Kingdom leans iPhone, everything below leans Android, and the worldwide bar sits close to Germany and Brazil.
Android vs iOS Market Share Worldwide
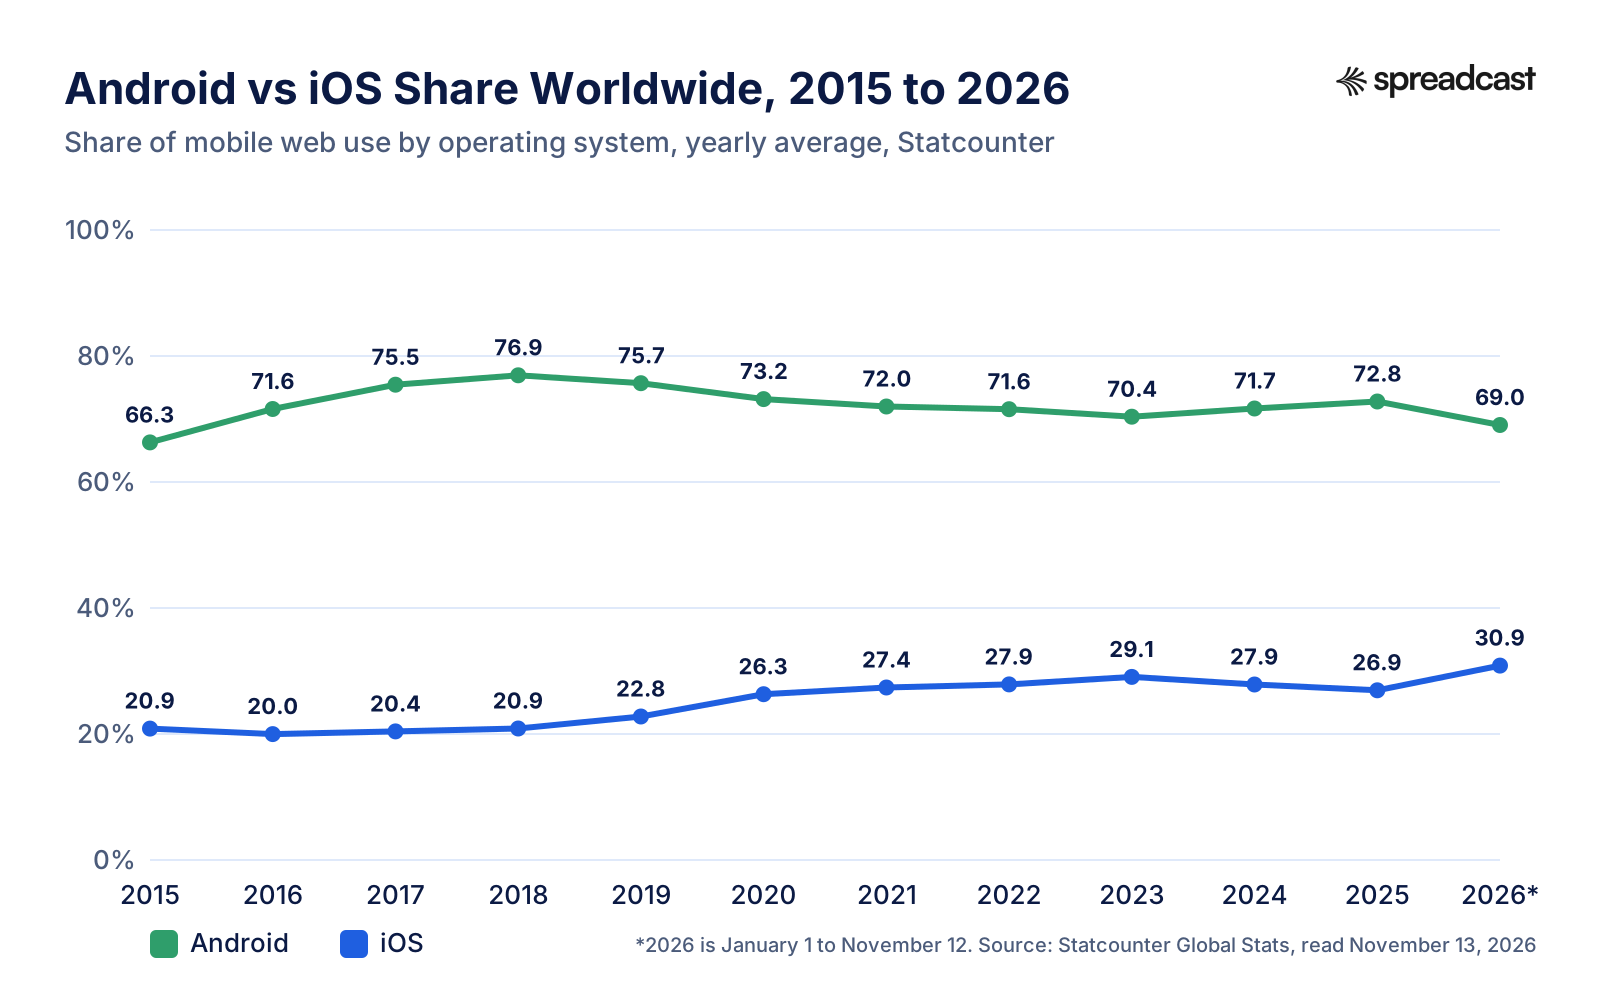
Worldwide, Android has held between roughly two thirds and three quarters of mobile web use for the whole of the last decade. Statcounter's worldwide page shows 72.36% Android and 27.61% iOS for October 2026. Everything else, from Samsung's own platform to KaiOS, adds up to well under one percent.
The monthly figure is more jumpy than most people expect. In Statcounter's monthly data, iOS climbed from 27.04% in October 2025 to between 30% and 33% for most of 2026, peaking at 32.56% in April and 32.52% in August, and then fell back to about 27.6% in October. Averaged over the twelve months to October 2026, the split is 69.33% Android and 30.53% iOS (derived). That average is the safer number to quote if you need one figure for planning.
Why the swings? Statcounter's FAQ explains that it measures page views on more than 1 million websites that carry its tracking code, over 3 billion page views a month, and that it bases its stats on page views rather than unique visitors. A phone that browses a lot counts more than a phone that browses a little, and a change in which sites carry the code can shift a country's numbers. None of that makes the data wrong. It makes it a measure of web activity by device, which is close to but not the same as the number of phones in pockets.
For a count of devices rather than page views, the platform owners give round numbers. Google said at The Android Show on May 13, 2025 that Android has more than 3 billion active devices in over 190 countries. Apple said in its first quarter results on January 29, 2026 that its installed base has more than 2.5 billion active devices, a figure that covers every Apple device, Macs, iPads and watches included, not just iPhones. Neither company publishes how it counts, so the two cannot be divided into a share.
Chart: Android vs iOS Share Worldwide From 2015 to 2026
Yearly averages from Statcounter. Android rose until 2018 as other phone systems disappeared, then slowly gave ground to iOS.
iPhone vs Android Market Share Over Time, 2015 to 2026
The iOS share of mobile web use by year in six places, from Statcounter's yearly data downloaded on November 13, 2026. Android is roughly the rest in each cell, minus a small slice for other systems. Use this table to see direction rather than to quote a single month.
| Year | Worldwide iOS | United States iOS | United Kingdom iOS | Europe iOS | Japan iOS | India iOS |
|---|---|---|---|---|---|---|
| 2015 | 20.86% | 50.93% | 47.21% | 28.88% | 66.06% | 1.77% |
| 2016 | 19.98% | 53.30% | 44.80% | 27.12% | 69.95% | 2.62% |
| 2017 | 20.41% | 53.99% | 49.41% | 28.24% | 67.51% | 3.10% |
| 2018 | 20.87% | 54.88% | 51.13% | 27.35% | 68.84% | 3.07% |
| 2019 | 22.77% | 55.25% | 49.25% | 26.52% | 69.34% | 2.67% |
| 2020 | 26.31% | 59.55% | 49.88% | 28.34% | 63.55% | 3.21% |
| 2021 | 27.38% | 58.59% | 51.85% | 32.11% | 66.55% | 3.05% |
| 2022 | 27.88% | 56.75% | 51.63% | 33.36% | 65.89% | 3.93% |
| 2023 | 29.06% | 58.12% | 52.29% | 34.92% | 68.76% | 3.99% |
| 2024 | 27.85% | 56.53% | 48.49% | 32.60% | 60.81% | 4.05% |
| 2025 | 26.94% | 58.22% | 48.35% | 35.35% | 60.60% | 4.44% |
| 2026, to November 12 | 30.85% | 58.89% | 50.67% | 38.58% | 60.61% | 6.09% |
Derived changes from 2015 to 2026 so far: iOS up 10.0 points worldwide (30.85 minus 20.86), up 8.0 points in the United States, up 9.7 points in Europe and up 4.3 points in India, and down 5.5 points in Japan. In 2015 Android's worldwide share was 66.29% partly because Nokia's Series 40, Windows phones, BlackBerry and Symbian still held about 9% between them; by 2020 those were all below 0.1%.
What Changed Between 2015 and 2026
Two things happened in the last eleven years, and they pulled in opposite directions. First, the old phone systems died. Series 40, Windows, BlackBerry and Symbian still showed up in 2015, and their users moved overwhelmingly to cheap Android phones, which is why Android's worldwide share climbed from 66.29% in 2015 to a peak of 76.94% in 2018. Second, once there was nobody left to convert, iOS started gaining slowly in the countries where people trade up: the United States, Europe and, from a tiny base, India.
Europe is the clearest example. Statcounter's yearly series has iOS at 28.88% of European mobile web use in 2015 and 38.58% in 2026 so far, and the Europe page shows 36.32% for October 2026. That is still an Android continent, but the gap has narrowed from about 35 points to about 23. The United Kingdom has spent the whole decade within a few points of a tie.
Japan went the other way. It was the most iPhone heavy big market in 2015 at 66.06% and has drifted to about 60.6% in 2025 and 2026, with October 2026 at 53.8% on the Japan page. Still an iPhone country, but less of one than it was.
India tells you how slow these shifts are. iOS went from 1.77% of Indian mobile web use in 2015 to 6.09% in 2026 so far. That is more than three times the share, and still about one phone in seventeen. If you are building for India, Android is the market, and the iPhone audience is a premium slice on top of it.
Sales Share vs Usage Share: Why the Two Numbers Disagree
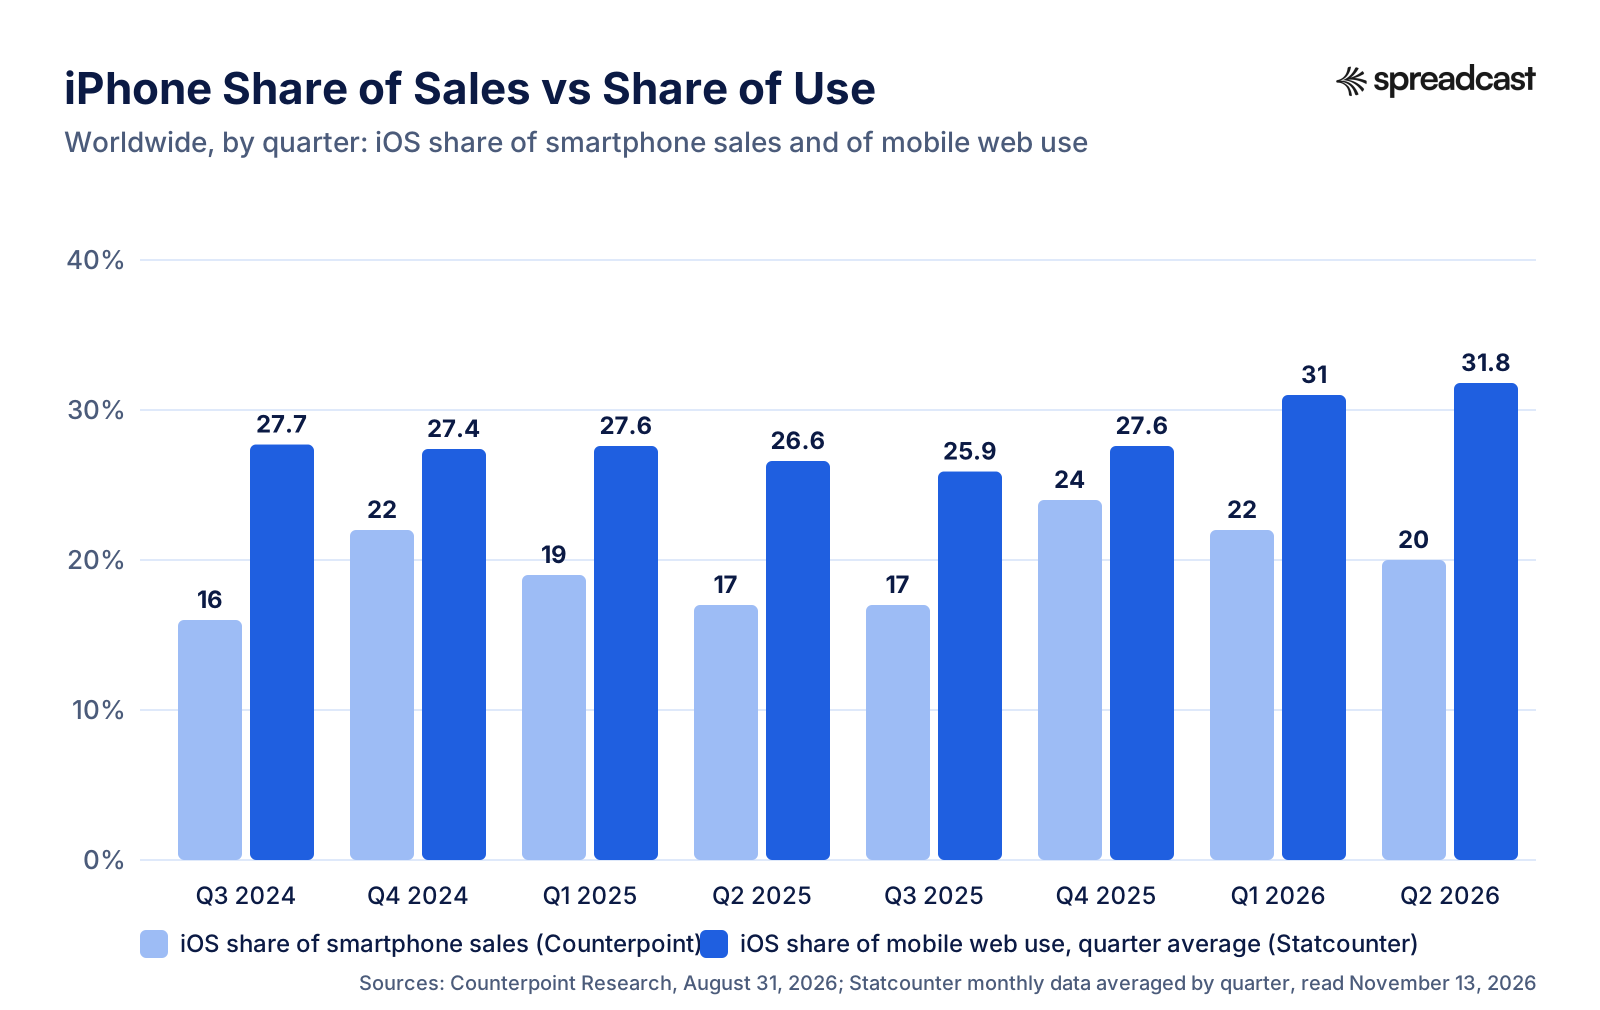
The most common confusion around iPhone vs Android market share is comparing a sales figure with a usage figure. Counterpoint's OS tracker gave iOS 20% of global smartphone sales in the second quarter of 2026. Statcounter's monthly data gives iOS an average of about 31.8% of mobile web use over the same three months (derived). Neither is wrong. They measure different things.
Sales share counts only the phones sold in that quarter. Usage share counts every phone in use, bought this year or five years ago. If iPhones stay in use longer, get passed on to a family member or get resold, they keep showing up in usage long after the sale. And if iPhone owners browse more websites than the average Android owner, they count for more page views per phone. We could not find a public measurement of either effect, so treat them as likely reasons, not proven ones.
Sales share also has a strong season. Apple launches new iPhones in September, so the fourth quarter is its big one. Counterpoint's table shows iOS at 22% of global sales in the fourth quarter of 2024 and 24% in the fourth quarter of 2025, against 16% to 17% in the third quarters of 2024 and 2025. In the United States the swing is wider: iOS took 65% of sales in the fourth quarter of 2024 and 69% in the fourth quarter of 2025, then fell back to 51% by the second quarter of 2026. If you see a headline that the iPhone has two thirds of the American market, check which quarter it is about.
There is one more reason the numbers drift apart: HarmonyOS. Huawei's phones in China now run HarmonyOS rather than Android, and Counterpoint counts them separately. Statcounter's China page has no HarmonyOS line, so the HarmonyOS phones are most likely inside its Android figure. Its FAQ does not say, so we cannot confirm it.
Smartphone Sales Share by Operating System, 2024 to 2026
Counterpoint Research's quarterly share of smartphone sales by operating system, from its global OS market share page, published August 31, 2026, which says its data covers 99% of the global handset market. The second quarter of 2026 is the newest quarter in the table on the day we read it.
| Quarter | Global Android | Global iOS | Global HarmonyOS | US iOS | China iOS | China HarmonyOS | India iOS |
|---|---|---|---|---|---|---|---|
| Q3 2024 | 80% | 16% | 4% | 52% | 14% | 17% | 5% |
| Q4 2024 | 74% | 22% | 4% | 65% | 17% | 19% | 11% |
| Q1 2025 | 76% | 19% | 5% | 55% | 14% | 19% | 8% |
| Q2 2025 | 79% | 17% | 4% | 50% | 16% | 17% | 6% |
| Q3 2025 | 79% | 17% | 4% | 55% | 14% | 18% | 8% |
| Q4 2025 | 72% | 24% | 3% | 69% | 22% | 16% | 10% |
| Q1 2026 | 73% | 22% | 5% | 58% | 17% | 19% | 10% |
| Q2 2026 | 75% | 20% | 5% | 51% | 18% | 24% | 9% |
Android in China was 58% of sales in the second quarter of 2026, with HarmonyOS at a record 24% and iOS at 18%. Counterpoint's page has no table for Europe or other regions. Shares are rounded to whole numbers by Counterpoint, so a row can add up to 99% or 101%.
Chart: iPhone Share of Sales vs Share of Use
Worldwide, iOS always has a bigger share of phones in use than of phones sold. The gap was about 12 points in the second quarter of 2026.
iOS Share of Sales vs Share of Use by Quarter
The same comparison for four markets, using Counterpoint's sales share and Statcounter's monthly usage share averaged by quarter (derived). India is the odd one out: there, iOS has a larger share of sales than of use.
| Quarter | World: sales / use | US: sales / use | China: sales / use | India: sales / use |
|---|---|---|---|---|
| Q3 2024 | 16% / 27.7% | 52% / 56.7% | 14% / 23.3% | 5% / 4.1% |
| Q4 2024 | 22% / 27.4% | 65% / 54.0% | 17% / 23.3% | 11% / 4.1% |
| Q1 2025 | 19% / 27.6% | 55% / 57.7% | 14% / 22.3% | 8% / 4.8% |
| Q2 2025 | 17% / 26.6% | 50% / 58.3% | 16% / 23.2% | 6% / 5.0% |
| Q3 2025 | 17% / 25.9% | 55% / 58.2% | 14% / 22.8% | 8% / 4.2% |
| Q4 2025 | 24% / 27.6% | 69% / 58.8% | 22% / 23.4% | 10% / 4.3% |
| Q1 2026 | 22% / 31.0% | 58% / 61.2% | 17% / 26.3% | 10% / 5.3% |
| Q2 2026 | 20% / 31.8% | 51% / 60.9% | 18% / 28.7% | 9% / 6.7% |
India's pattern fits a market where the iPhone is new and growing: phones sold today are a bigger iPhone slice than the phones already in use, which were bought years ago when the iPhone was rarer. Expect Indian usage share to keep creeping up as those sales age into the installed base.
Smartphone Shipments in 2026: Apple's Record Share of a Shrinking Market
Shipment trackers count phones leaving factories for stores, which is a third way of measuring share. IDC's preliminary figures, dated October 14, 2026, show 255.3 million smartphones shipped worldwide in the third quarter of 2026, down 22.0% from 327.3 million a year earlier, which IDC calls the largest yearly fall in its data. Samsung shipped 57.8 million (22.6%) and Apple 57.3 million (22.4%), only 500,000 apart. Apple's shipments fell 4.0%, the smallest decline among the top five, while Xiaomi, OPPO and vivo fell by 29% to 35%.
Counterpoint's numbers point the same way. Its October release, reported by 9to5Mac on October 12, 2026, put Apple at 22% of third quarter shipments against 18% a year earlier, with Samsung at 23%, in a market down 20% to its lowest third quarter level in 14 years. Counterpoint's revenue release of November 3, 2026 adds the money side: smartphone revenue grew 3% to $114 billion even as shipments fell 19%, the average selling price reached a record $442, and Apple took 50% of all smartphone revenue in the quarter.
What does a shrinking market with more iPhones in it mean? Cheaper Android phones are the ones not being bought: in IDC's table the brands that sell mostly budget and mid range Android phones lost the most volume, while Apple barely moved. For an app maker, the Android audience is not shrinking, since old phones stay in use, but far fewer new budget Android phones arrived in the third quarter of 2026 than a year earlier. The phones your Android users hold are getting older on average, which is one more reason to keep your minimum Android version low.
Over a longer stretch, Apple's share of shipments has crept up almost every year. Counterpoint's eight year table, published September 15, 2026, has Apple at 13.2% of global shipments in 2019, 15.1% in 2020, 17.1% in 2021, 18.5% in 2022, 19.3% in 2023, 18.2% in 2024, 19.7% in 2025 and 20.9% in the first half of 2026. Samsung's share stayed between 18.4% and 21.8% over the same years.
Apple Share of Smartphone Shipments vs iOS Share of Use, by Year
Apple's share of global smartphone shipments from Counterpoint, next to the yearly iOS share of mobile web use from Statcounter. Apple is the only maker of iOS phones, so its shipment share is the iOS shipment share.
| Year | Apple share of global shipments | Samsung share of global shipments | iOS share of mobile web use worldwide |
|---|---|---|---|
| 2019 | 13.2% | 20.1% | 22.77% |
| 2020 | 15.1% | 19.2% | 26.31% |
| 2021 | 17.1% | 19.6% | 27.38% |
| 2022 | 18.5% | 21.2% | 27.88% |
| 2023 | 19.3% | 19.3% | 29.06% |
| 2024 | 18.2% | 18.4% | 27.85% |
| 2025 | 19.7% | 19.2% | 26.94% |
| 2026 | 20.9% (first half) | 21.8% (first half) | 30.85% (to November 12) |
Derived: the gap between iOS usage and Apple's shipment share narrowed from 9.6 points in 2019 (22.77 minus 13.2) to 7.2 points in 2025 (26.94 minus 19.7). The usage figure always leads, which fits the idea that iPhones stay in use longer than the average phone, though neither source measures that directly.
Android vs iOS Market Share in the US
The United States is the one huge app market where iOS leads Android on every measure we checked. Statcounter's United States page shows iOS at 51.96% and Android at 48.02% of mobile web use in October 2026. That October reading is the lowest of the year: over the twelve months to October 2026 iOS averaged 59.22% (derived), and in August 2026 it was 60.71% in Statcounter's monthly data.
The yearly series is steadier. iOS has been above 50% of American mobile web use every year since 2015, rising from 50.93% that year to 59.55% in 2020 and 58.89% in 2026 so far. Counterpoint's sales data agrees on direction, with iOS at between 50% and 69% of United States smartphone sales in every quarter from the third quarter of 2024 to the second quarter of 2026, per its OS share page.
The money follows the phones. Appfigures, as reported by TechCrunch on January 14, 2026, estimates United States consumer spending in apps and games at $55.5 billion in 2025, up 18.1%, on 10 billion downloads, down 4.2%. Sensor Tower's State of Mobile 2026 puts the figure at nearly $60 billion and calls the United States the largest mobile market by revenue. Neither splits the American total by store in its free summary, but with iOS ahead on both usage and sales, it is a safe guess that most of that spending runs through the App Store.
For an app maker based in the US, the practical upshot is simple: if you can only ship one platform first and you plan to charge money, iOS is usually the safer first bet at home. If you depend on ads or need the widest reach in the Americas, look at the Android share next door in Brazil, where Android had 73.76% in October 2026. Our guide to iOS app marketing covers the Apple side of the launch.
Android vs iOS Market Share in the UK
The United Kingdom is the closest thing to a tie among large markets. Statcounter's UK page has iOS at 50.14% and Android at 49.85% in October 2026, and the twelve month average is almost the same at 50.49% iOS (derived). Over the yearly series the lead has changed hands several times: iOS was ahead in 2015, 2017, 2018, 2021, 2022, 2023 and 2026 so far, Android in 2016, 2019, 2024 and 2025, and the two were dead level in 2020 at 49.88% each.
For a British app, that means you cannot skip either store without giving up about half the market. It also means your marketing has to work for both. A post that only shows an App Store badge, or a landing page that hides the Google Play link, speaks to half the people who see it. Sensor Tower's second quarter 2026 report notes that the UK, Germany and France together added $500 million in app revenue across iOS and Google Play, so British spending is still growing.
Android vs iOS Market Share in Europe and Germany
Across Europe as a whole, Android leads. Statcounter's Europe page shows Android at 63.67% and iOS at 36.32% in October 2026, with iOS averaging 38.73% over the twelve months to October (derived). The iOS share has risen from 28.88% in 2015 to 38.58% in 2026 so far, almost ten points, with most of the gain coming from 2021 onward.
Germany needs a warning label. Statcounter's Germany page has Android at 72.29% and iOS at 27.7% in October 2026, but iOS averaged 36.63% over the twelve months to October (derived), and in Statcounter's monthly data it was 44.82% in May 2026 and 39.06% in June before dropping to 33.02% in July and about 27.6% from August to October. An eleven point fall in two months is not how phone ownership behaves, since people do not swap their phones that fast, so we read it as a change in the sites or traffic Statcounter measures. If you need one number for Germany, the twelve month average is the better guess, and Android is the larger platform either way.
Android vs iOS Market Share in India
India is the most lopsided of the big markets. Statcounter's India page has Android at 94.84% and iOS at 5.1% of mobile web use in October 2026, and the twelve month average is 94.04% Android and 5.87% iOS (derived). On the sales side, Counterpoint gives iOS between 5% and 11% of Indian smartphone sales in each quarter from the third quarter of 2024 to the second quarter of 2026, with 9% in the newest quarter.
India is also the biggest download market in the world. A summary of Sensor Tower's State of Mobile 2026 by Game Dev Reports, dated January 30, 2026, says India recorded 25.5 billion app installs in 2025, far ahead of the United States and Brazil in second and third place. Almost all of those installs happen on Android.
For an app maker, India is where downloads are cheap and plentiful and revenue per user is low. If your app runs on ads, needs a large free user base or competes in a category like education or utilities, an Android first launch in India can make sense. If you sell subscriptions, plan for prices well below Western ones and expect most paying users to come from the small iPhone slice and from higher end Android phones. Our cost per install benchmarks show how much cheaper installs are in markets like this.
Android vs iOS Market Share in China, and HarmonyOS
China is the market where "Android vs iOS" leaves out a third player. Counterpoint reports that in the second quarter of 2026 HarmonyOS, Huawei's own system, took a record 24% of Chinese smartphone sales, ahead of iOS at 18%, with Android at 58%. Globally HarmonyOS had 5% of sales in the same quarter, almost all of it in China. In the eight quarters Counterpoint lists, HarmonyOS ranged from 16% to 24% of Chinese sales and iOS from 14% to 22%.
Statcounter's China page shows Android at 69.46% and iOS at 30.49% for October 2026, with no HarmonyOS line. The iOS share there has risen through 2026, from a yearly average of 22.87% in 2025 to 28.01% in 2026 so far, and a quarterly average of 30.1% in the third quarter of 2026 (derived).
The bigger point for app makers outside China is about stores, not phones. Trackers handle China differently: the Game Dev Reports summary of Sensor Tower's 2025 data notes that its China revenue of $22.1 billion, second only to the United States, counts only iOS and leaves out the Android app stores in China. So the money figures for "Google Play" on this page and elsewhere describe Android outside China. If China is in your plan, it needs its own research into local Android stores; if not, your Android market is the rest of the world.
Android vs iOS Market Share in Japan, Australia and Canada
These three are the iPhone strongholds. Canada had the highest iOS share of the markets we checked, 64.74% in October 2026 and 63.80% averaged over twelve months (derived). Australia was close behind at 62.09% in October and 61.64% averaged. Both numbers are stable from month to month, so you can plan on roughly two iPhones for every Android phone in both countries.
Japan is still an iPhone country but less firmly than it was. iOS had 53.8% in October 2026 and averaged 60.86% over twelve months (derived), down from yearly figures between 63.55% and 69.95% in 2015 to 2023. October was the low point of the year in Statcounter's monthly data; iOS was above 60% in August and September.
If you sell to these markets, an iOS first plan is easy to defend. Paying users are there: Sensor Tower's Q3 2026 report lists Japan among the five markets where ChatGPT was the top app by in app purchase revenue, alongside the United States, the United Kingdom, France and Brazil. Do not read that as a reason to skip Android, though. In Japan four phones in ten were still Android on the October figure.
Android vs iOS Market Share in Brazil and Indonesia
Brazil and Indonesia are big, young, Android first markets. Statcounter's Brazil page has Android at 73.76% and iOS at 26.23% in October 2026, with a twelve month iOS average of 20.39% (derived). Indonesia shows 78.68% Android and 21.28% iOS in October, with a twelve month iOS average of 18.00% (derived). In both, iOS rose during 2026, from about 14% to 17% in October 2025 in Statcounter's monthly data.
Brazil also sits third in the world for downloads, behind India and the United States, according to the Game Dev Reports summary of Sensor Tower's data. For a Portuguese or Spanish language app, or any app chasing volume in Latin America or Southeast Asia, Google Play is where most of the installs will come from, and your Google Play store listing deserves as much care as your App Store page. Our guide on how to promote an Android app covers what to do in these markets beyond the listing.
Tablet Market Share: iPad vs Android Tablets
Tablets are much closer than phones. Statcounter's tablet page shows the worldwide split for October 2026, and its United States tablet page the American one. The twelve month average is derived from Statcounter's monthly tablet data.
| Measure | iOS (iPadOS) | Android | Source |
|---|---|---|---|
| Tablet web use worldwide, October 2026 | 47.72% | 52.19% | Statcounter, tablet, worldwide |
| Tablet web use worldwide, 12 month average to October 2026 (derived) | 52.20% | 47.65% | Statcounter monthly tablet data, downloaded November 13, 2026 |
| Tablet web use in the United States, October 2026 | 53.37% | 46.51% | Statcounter, tablet, United States |
| iPads on iPadOS 26, all devices | 68% | Not applicable | Apple, measured June 7, 2026 |
October 2026 was the first month in the twelve where Android tablets led worldwide on Statcounter's figure; in every other month the iPad was ahead, with between 50.29% and 55.74%. If your app has a tablet layout, the iPad is roughly half of the tablet audience worldwide and the larger half in the United States.
Android Version Stats: Which Android Versions Are People Using?
Two sources, two methods. Google's own distribution data, published through Android Studio in a file marked as last updated October 1, 2026, counts devices. Statcounter's Android version page counts web page views from Android phones and tablets in October 2026. The "at least this version" column is derived by adding up Google's shares from the newest version down, and it is the figure you need when you choose a minimum SDK.
| Android version (API level) | Google, share of devices | Google, devices on at least this version (derived) | Statcounter, share of Android web use |
|---|---|---|---|
| Android 17 (API 37) | 0.9% | 0.9% | Not in the top six shown |
| Android 16 (API 36) | 25.4% | 26.3% | 37.71% |
| Android 15 (API 35) | 14.7% | 41.0% | 16.34% |
| Android 14 (API 34) | 15.3% | 56.3% | 11.45% |
| Android 13 (API 33) | 11.8% | 68.1% | 10.9% |
| Android 12 (API 31) | 9.6% | 77.7% | 7.11% |
| Android 11 (API 30) | 10.5% | 88.2% | 6.08% |
| Android 10 (API 29) | 5.7% | 93.9% | Not in the top six shown |
| Android 9 (API 28) | 3.1% | 97.0% | Not in the top six shown |
| Android 8.1 (API 27) | 1.5% | 98.5% | Not in the top six shown |
| Android 8.0 (API 26) | 0.5% | 99.0% | Not in the top six shown |
| Android 7.0 to 7.1, 6 and 5.1 (API 22 to 25) | 0.9% together | 99.9% | Not in the top six shown |
Google's shares add up to 99.9%, so the cumulative column tops out there. Google's file has no line for Android 12L (API 32). The two sources disagree on Android 16 by more than 12 points, most likely because newer phones browse more and because Statcounter weights by page views while Google counts devices.
Android Version Distribution: What It Means for Your Minimum SDK
Android 16 is now the most used version by both counts, but it is far from a majority. On Google's data, 43.6% of devices still run Android 13 or older (derived: the shares for Android 13 and everything below it added together). Compare that with Apple: its App Store support page says 79% of all iPhones and 86% of iPhones introduced in the last four years were on iOS 26 when Apple measured on June 7, 2026. That gap is the practical meaning of Android fragmentation.
For a new app the usual question is how low to set the minimum version. Using Google's cumulative numbers, a minimum of Android 8.0 (API 26) reaches about 99.0% of devices, Android 10 (API 29) about 93.9%, Android 11 (API 30) about 88.2% and Android 12 (API 31) about 77.7%. Each step up removes old code paths and testing work and drops a slice of potential users. Many teams settle somewhere around Android 8 to 10 and revisit once a year.
The target version is a different rule, and Google Play enforces it. Google's target API level page says that starting August 31, 2026, new apps and app updates must target Android 16 (API level 36) or higher to be submitted to Google Play, with lower targets for Wear OS, Android Automotive, Android TV and Android XR. Existing apps must target at least Android 15 (API level 35) to stay available to new users on newer devices, and developers could request an extension to November 1, 2026. Targeting a new version does not stop your app from running on older phones; the minimum SDK decides that.
Google's public distribution dashboard on developer.android.com now mostly covers screens and graphics support, with a snapshot of devices active in a 7 day period ending November 24, 2025, and it points developers to Reach and devices in Play Console for richer data. Google's Android Developers Blog introduced Reach and devices on July 13, 2021 as a tool to plan for quality reach, with breakdowns by country, Android version, RAM and chipset, and comparisons with peer apps. If you already have an app on Google Play, your own Reach and devices data beats any public average. Launching for the first time? Our step by step guide to publishing an app on Google Play covers the target API rule in context.
Video: Reach and Devices in Play Console for Choosing Countries and Devices
Google's Android Developers channel walks through the Play Console tools that show which countries, Android versions and devices your users and your peers' users have.

Google Play Statistics: How Many Apps Are on Google Play?
No official count exists, because Google does not publish one; Apple does, once a year. The trackers below count what they can find in each store. Each row is from a page we opened on November 13, 2026, and the App Store rows are there for comparison.
| Measure | Google Play | App Store | Source and date |
|---|---|---|---|
| Apps listed | 2,696,134 | 2,837,782 | 42matters, Google Play and App Store, pages updated November 13, 2026 |
| Apps listed, second tracker | 2,090,391 | Not tracked | AppBrain, page updated November 12, 2026 |
| Apps on the store, official count | Not published | 2,172,472 | Apple, 2025 App Store Transparency Report, calendar year 2025 |
| Games | 345,241 (12.81%) | 279,857 (9.86%) | 42matters, November 13, 2026 |
| Free to download | 97.09% | 95.01% | 42matters, November 13, 2026 |
| Publishers with an app | 813,635 | 1,212,602 | 42matters, November 13, 2026 |
| New apps per day, average | 3,219 | 5,896 | 42matters, November 13, 2026 |
| New apps in the last month | 110,033 | 133,310 | 42matters, November 13, 2026 |
| New apps and removals in October 2026 | 78.8 thousand launched, 27.4 thousand removed, 51.4 thousand net | Not tracked | AppBrain |
| Apps with at least one rating | 1,226,681 (45.5%) | Not compared here | 42matters, November 13, 2026 |
Derived from 42matters: the App Store lists 141,648 more apps than Google Play (2,837,782 minus 2,696,134), and receives about 1.8 times as many new apps a day (5,896 divided by 3,219). The two trackers disagree on Google Play by about 606,000 apps because they crawl differently and count removed or region locked listings differently. Quote the tracker by name.
Android Usage Statistics: Devices, Users and the Size of Google Play
Google's own description of Google Play, on its How Google Play Works page, says the store has more than 3 billion monthly users across 190 or more markets, supports over 320 local forms of payment across more than 65 markets and runs on over 24,000 different device models. Apple's 2025 Transparency Report counts 892,670,823 average weekly visitors to the App Store, in 175 countries and regions. Weekly visitors and monthly users are different measures, so the two cannot be compared directly, but the order of magnitude is clear: Google Play reaches more people.
Those 24,000 device models are the reason Android testing takes longer. Your app has to look right on a budget phone with 4 GB of memory in Jakarta and on a foldable in Seoul. Apple's lineup of iPhones and iPads is far smaller. That cost is real and should go into the "which platform first" decision alongside the market share numbers.
The App Store is also where more new apps are appearing. RevenueCat's State of Subscription Apps 2026, built on more than 115,000 apps and over $16 billion in revenue, says iOS accounts for about 77% of new subscription app launches, up from about 67% in 2023. Fewer new competitors arriving on Google Play is one of the quieter arguments for an Android version.
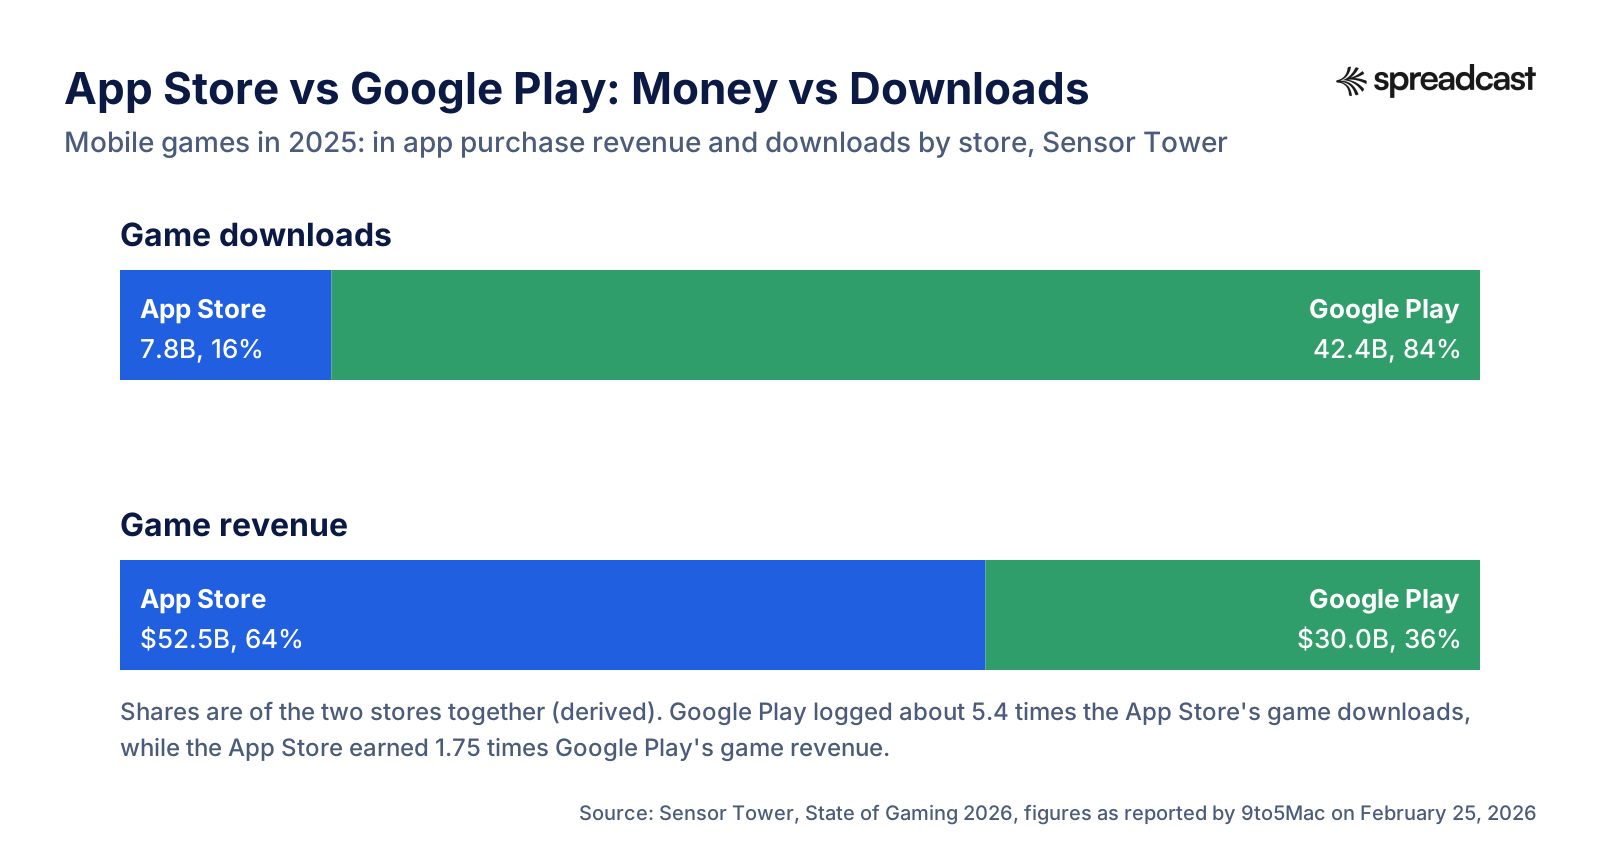
Chart: App Store vs Google Play, Money vs Downloads
Mobile games are the one category where a store split for 2025 is public. Google Play has most of the downloads, and the App Store has most of the money.
App Store vs Google Play: Consumer Spending and Downloads
The money side of iPhone vs Android market share. Totals for both stores come from Sensor Tower and Appfigures, which model the stores independently and land on different totals. Per store splits are published for games and for growth rates; neither tracker gives a full per store dollar split for all apps in its free reports, so we have not invented one.
| Measure | App Store (iOS) | Google Play (Android) | Source and period |
|---|---|---|---|
| Mobile game in app purchase revenue, 2025 | $52.5 billion, up 0.6% | $30 billion | Sensor Tower, as reported by 9to5Mac, February 25, 2026 |
| Mobile game downloads, 2025 | 7.8 billion, down 5.7% | 42.4 billion, down 7.3% | Same report. Sensor Tower's own summary rounds Google Play to 42 billion, more than four times the App Store. |
| Game revenue per game download, 2025 (derived) | About $6.73 | About $0.71 | 52.5 ÷ 7.8 and 30 ÷ 42.4, from the two rows above |
| In app purchase revenue growth, second quarter of 2026 | Up 3% year over year | Up 10% year over year | Sensor Tower, Q2 2026 Digital Market Index, August 2026 |
| Revenue and downloads, third quarter of 2026 | Google Play grew revenue faster than iOS | Google Play had the vast majority of downloads | Sensor Tower, Q3 2026 Digital Market Index, November 2026, on $45 billion of revenue (up 4.4%) and 37.6 billion downloads (up 0.1%) across both stores |
| Both stores, 2025, Sensor Tower | $167 billion in app purchase revenue, up 10.6% | Nearly 150 billion downloads, up 0.8% | Sensor Tower, State of Mobile 2026, January 2026 |
| Both stores, 2025, Appfigures | $155.8 billion in consumer spending, up 21.6% | 106.9 billion downloads, down 2.7% | Appfigures, as reported by TechCrunch, January 14, 2026 |
| Subscription cancellations caused by billing errors | 14% | 31% | RevenueCat, State of Subscription Apps 2026 summary, March 19, 2026 |
| Share of new subscription app launches | About 77% | About 23% (derived: 100% minus 77%) | RevenueCat, State of Subscription Apps 2026, launches from February 2022 to February 2026 |
Read the rows together and the pattern is the same one the usage numbers show: Google Play is where the volume is and the App Store is where most of the money is, with Google Play's revenue growing faster in 2026. For games, the derived revenue per download on the App Store is about 9.5 times Google Play's (6.73 ÷ 0.71).
Why iPhone Users Spend More in Apps
The share of money is far bigger than the share of phones, and the reasons are mostly about who owns which phone and where. iPhones are concentrated in rich markets: the United States, Canada, Australia, Japan, the United Kingdom and Western Europe are all above the world average for iOS. Android dominates India, Indonesia and Brazil, where incomes and app prices are lower. A dollar weighted map of phone owners looks much more like the iPhone map than the Android map.
Price matters inside each country too. Counterpoint's revenue release says Apple took 50% of all smartphone revenue in the third quarter of 2026 with around a fifth of shipments, which tells you the average iPhone buyer pays far more for the phone. People who spend more on the phone tend to be the people who can spend more inside it, though no source we found measures that link directly.
There are also store mechanics. RevenueCat found that billing errors cause 31% of subscription cancellations on Google Play against 14% on the App Store, a gap it calls the Google Play tax, so some Android revenue is lost to failed payments rather than to unhappy users. And the Q2 2026 Sensor Tower report shows Google Play revenue growing 10% a year against 3% on iOS, so the gap is narrowing, slowly.
None of this makes Android a bad business. A free app that earns from ads, a marketplace that takes a cut of real world purchases, or a game built for volume can do better on Google Play, because downloads are where it gets paid. The mobile game market statistics page goes deeper on how games split between the two stores, and our mobile game marketing guide covers how to market to each.
iOS or Android First? What the Market Share Data Means for App Makers
Most teams end up on both stores. The question is which one gets your first months. Each card ties one finding on this page to a decision.
Selling Subscriptions or Paid Features in the US, Canada, Australia or Japan: iOS First
iOS has 51.96% to 64.74% of mobile web use in these four markets in October 2026, and the App Store earned 1.75 times Google Play's game revenue in 2025. If revenue per user is the number that keeps you alive, the iPhone audience is where to start. Plan the launch with how to market an app and keep Android on the roadmap.
Building for India, Indonesia, Brazil or Most of Europe: Android First
Android has 94.84% of mobile web use in India, 78.68% in Indonesia, 73.76% in Brazil and 63.67% across Europe. An iOS only launch there reaches between one person in twenty and one in three. Prepare a proper Google Play listing with Google Play screenshot sizes that fit, rather than a quick port of your App Store page.
Free App Earning From Ads: Follow the Downloads
Google Play logged about 5.4 times the App Store's game downloads in 2025 and Sensor Tower says it holds the vast majority of downloads overall. When your income scales with users rather than with spend per user, Android's volume matters more than iOS's higher revenue per install. Check cost per install benchmarks before you buy installs on either store.
The UK: Plan for Both From Day One
With iOS at 50.14% and Android at 49.85% in October 2026, skipping either platform gives up half the market. If you have to stagger, stagger by weeks, not quarters, and keep both store links on every page and post from launch day.
Choose Your Android Minimum Version From Google's Numbers
A minimum of Android 8.0 reaches about 99.0% of devices on Google's October 2026 data, Android 10 about 93.9% and Android 12 about 77.7%. Since August 31, 2026, new apps and updates must also target Android 16 to be accepted on Google Play. Decide the minimum once, write it down and revisit it each year.
Testing Budget: Android Costs More per Percent of Users
Google Play runs on over 24,000 device models, and 43.6% of Android devices are on Android 13 or older. iPhones update fast: 79% of all iPhones ran iOS 26 by June 2026. Budget more testing time for Android, and use Reach and devices in Play Console to pick the phones your users actually have.
Two Stores, One Marketing Plan
Whichever store you start on, your social posts, release notes and launch page should point to the store your audience uses. In markets that are close to even, show both badges. A scannable code from the App Store QR code generator on a poster or slide sends each phone to its own store, and Spreadcast takes either store link and treats an app on both stores as one app, so one set of posts covers both.
Watch the Trend, Not the Month
Statcounter's monthly figures swing by several points; the United States went from 60.71% iOS in August 2026 to 51.96% in October. Base decisions on twelve month averages or yearly figures, and on your own analytics once you have users.
Which Store First, Market by Market
A planning table built from the country figures above. The suggestion column is our reading of the data for an app that earns from purchases or subscriptions; an ad funded app should lean further toward Android in every row.
| Market | iOS share, 12 month average (derived) | Leader on usage | Suggested first store for a paid or subscription app |
|---|---|---|---|
| Canada | 63.80% | iOS | App Store |
| Australia | 61.64% | iOS | App Store |
| Japan | 60.86% | iOS | App Store |
| United States | 59.22% | iOS | App Store, with Google Play close behind |
| United Kingdom | 50.49% | Level | Both at once |
| Europe | 38.73% | Android | Both, with Google Play not far behind on revenue |
| Germany | 36.63% | Android | Google Play for reach, App Store for revenue; both early |
| China | 27.64% | Android and HarmonyOS | App Store; research local Android stores separately |
| Brazil | 20.39% | Android | Google Play |
| Indonesia | 18.00% | Android | Google Play |
| India | 5.87% | Android | Google Play |
Averages derived from Statcounter's monthly data for November 2025 to October 2026. For China, Counterpoint's sales data puts HarmonyOS at 24% and iOS at 18% in the second quarter of 2026, and trackers count only iOS revenue there.
Marketing an App That Lives on Both Stores
Market share tells you where your users are. It does not tell them that your app exists. Most apps that fail on either store fail quietly, with a decent listing that nobody visits. After the store pages are ready, the next job is telling people, and doing it in a way that sends each person to the right store.
Start with the stores themselves, because search inside the store still brings most downloads. For Apple, follow the App Store optimization guide and the App Store screenshot sizes. For Android, Google Play ranks apps on different signals and shows a different set of assets, so read the Google Play ASO guide and size your graphics with the Google Play screenshot sizes reference. Both stores reward ratings, and the method in how to get App Store reviews works on Google Play too.
Then go where your audience scrolls. A user in São Paulo and a user in Toronto are on different phones and often on different networks, but both see posts. Announce every update with a short post that shows the new screen, because, as the app update announcement examples show, most users never open the store's update notes. Our guide on how to promote an app on social media covers what to post on each network, and how to get app downloads puts it into a plan. If writing and designing those posts every week is the part that never happens, that is the part Spreadcast automates from your store link.
Paid acquisition follows the same map. iOS installs usually cost more and earn more; Android installs are cheaper, and there are far more of them. Before spending, read how to advertise an app, and for the Apple side specifically, Apple Search Ads. Then measure retention by platform with the app retention benchmarks, because an install that never comes back costs the same on either store.
Spreadcast Takes an App Store or a Google Play Link
Whichever platform your users are on, they need to hear about your app somewhere other than the store. That is the job we built Spreadcast for. Paste your App Store link or your Google Play link at the start page, or type your app's name, and Spreadcast reads the public listing: your icon, colors, real screenshots and description. From that it builds a brand kit and starts designing posts and writing captions for each network.
An app that is only on Google Play is drawn in an Android phone frame, so your posts show the phone your users actually hold. An app on both stores is one app in Spreadcast, not two: you get one brand, one calendar and one set of posts, and Spreadcast reads the ratings of both listings.
Then it keeps going without you. Spreadcast checks your listing for news: when a new version with a version number shows up, it makes an update post, and when your rating passes a milestone, it makes a rating post. On top of those, a weekly plan mixes feature, review, tips, problem and seasonal posts at your posting times. Posts go to Instagram, Facebook, LinkedIn, TikTok, YouTube, Pinterest, Threads, Bluesky, Mastodon, Telegram and Discord. TikTok posts land in your TikTok drafts by default and are never pushed to the feed on their own, and you can keep approve first on for everything else.
On price: the free plan makes 3 posts for you to download, with a small Spreadcast mark and no publishing, so you can judge the design first. Pro is $29 a month or $290 a year, with clean posts, publishing to up to 10 social accounts and autopilot. If you would rather not subscribe, a Post Pack is $19 once for 10 posts designed and published, and a 30 Day Pass is $39 once for everything in Pro for 30 days. Paid plans have a 7 day full refund. The details are on the pricing page, the app maker overview is on Spreadcast for mobile apps, and how the publishing works is on the auto post to social media page.
How We Checked These Numbers, and Where Sources Disagree
Every source on this page was opened on November 13, 2026 and each figure read from the page itself. Statcounter's yearly series comes straight from its yearly view, downloaded the same day. The quarterly and 12 month averages are our own calculation from its monthly data, and every one of them is labeled derived. Google's Android version shares were read from its Android Studio distribution file. Where two sources answer the same question differently, both are below with the most likely reason.
| Question | One answer | Another answer | Why they differ |
|---|---|---|---|
| What share of phones run iOS worldwide? | 27.61% of mobile web use, October 2026 (Statcounter) | 20% of smartphone sales, second quarter of 2026 (Counterpoint) | Usage counts every phone in use, weighted by page views; sales count only phones sold that quarter. |
| What share of phones run iOS in the United States? | 51.96% in October 2026, 59.22% averaged over 12 months (Statcounter, derived) | Between 50% and 69% of sales per quarter (Counterpoint) | Monthly swings in web data, and the September iPhone launch lifting fourth quarter sales. |
| What was Apple's shipment share in the third quarter of 2026? | 22.4% (IDC, preliminary) | 22% in Counterpoint's October release, reported by 9to5Mac | Two trackers with similar results. Counterpoint's November revenue release gives Samsung 22% and does not restate Apple's share. |
| How many apps are on Google Play? | 2,696,134 (42matters) | 2,090,391 (AppBrain) | Different crawl methods. Google publishes no count. |
| Which Android version is most used, and by how much? | Android 16 at 25.4% of devices (Google) | Android 16 at 37.71% of Android web use (Statcounter) | Devices against page views. Newer phones likely browse more. |
| How big was the app market in 2025? | $167 billion, nearly 150 billion downloads (Sensor Tower) | $155.8 billion, 106.9 billion downloads (Appfigures, via TechCrunch) | Independent models of the same market, which even disagree on whether downloads rose or fell. |
| Is HarmonyOS part of Android? | Counted separately: 24% of Chinese sales in Q2 2026 (Counterpoint) | Not listed on Statcounter's China page | Statcounter does not say how it classifies HarmonyOS, so it is most likely inside its Android figure. |
Left out on purpose: an all apps App Store vs Google Play dollar split for 2025, because the page that publishes it blocked our reader and we would not quote it unopened; Statista charts behind a paywall; and any share without a named publisher and period. Statcounter's FAQ describes its method as page views on more than 1 million sites, over 3 billion a month.
Frequently Asked Questions
What is the Android vs iOS market share in the US?
iOS leads. Statcounter shows iOS at 51.96% and Android at 48.02% of mobile web use in the United States in October 2026, and iOS averaged 59.22% over the twelve months to October (our calculation from its monthly data). Counterpoint gives iOS 51% of United States smartphone sales in the second quarter of 2026 and 69% in the fourth quarter of 2025.
What is the Android vs iOS market share worldwide?
About 72% Android and 28% iOS by use. Statcounter shows 72.36% Android and 27.61% iOS in October 2026, and about 69.3% and 30.5% averaged over twelve months (our calculation from its monthly data). By sales, Counterpoint has Android at 75%, iOS at 20% and HarmonyOS at 5% in the second quarter of 2026.
Is Android or iPhone more popular?
Worldwide, Android, by a wide margin: roughly seven phones in ten. In the United States, Canada, Australia and Japan the iPhone is more popular, and in the United Kingdom the two are level. In India, Indonesia and Brazil Android has between 73% and 95% of use.
What is the Android vs iOS market share in the UK?
Almost exactly even. Statcounter has iOS at 50.14% and Android at 49.85% in October 2026, and the twelve month average is about 50.5% iOS by our calculation. The lead has switched between the two several times since 2015.
What is the Android vs iOS market share in India?
Statcounter shows Android at 94.84% and iOS at 5.1% of mobile web use in October 2026. iOS is growing from a small base: Counterpoint gives it 9% of Indian smartphone sales in the second quarter of 2026.
What is the Android vs iOS market share in Europe?
Android leads with 63.67% against 36.32% for iOS in October 2026, per Statcounter's Europe page. The iOS share has risen from 28.88% in 2015 to about 38.6% in 2026 so far. Germany is more Android heavy, the United Kingdom is level.
How many apps are on Google Play?
About 2.7 million by 42matters, which counted 2,696,134 on November 13, 2026, or about 2.1 million by AppBrain, which counted 2,090,391 on November 12, 2026. Google does not publish an official number.
What Android version is most used?
Android 16. Google's Android Studio distribution data, updated October 1, 2026, puts it on 25.4% of devices, followed by Android 14 at 15.3% and Android 15 at 14.7%. Statcounter puts Android 16 at 37.71% of Android web use in October 2026.
Where These Facts Come From
Every outside number, rule and price on this page links to the page it was taken from.
- Mobile operating system market share worldwide, October 2026Statcounter
- Mobile operating system market share in the United StatesStatcounter
- Mobile operating system market share in the United KingdomStatcounter
- Mobile operating system market share in EuropeStatcounter
- Mobile operating system market share in ChinaStatcounter
- Mobile operating system market share in JapanStatcounter
- Mobile operating system market share in AustraliaStatcounter
- Mobile operating system market share in CanadaStatcounter
- Mobile operating system market share in GermanyStatcounter
- Mobile operating system market share in BrazilStatcounter
- Mobile operating system market share in IndonesiaStatcounter
- Mobile operating system market share in IndiaStatcounter
- Tablet operating system market share worldwideStatcounter
- Tablet operating system market share in the United StatesStatcounter
- Android version market share worldwideStatcounter
- Statcounter Global Stats FAQ: how the data is collectedStatcounter
- Global smartphone sales share by operating system (August 31, 2026)Counterpoint Research
- Global smartphone shipments share, last eight years (September 15, 2026)Counterpoint Research
- Global smartphone revenue rises 3% in the third quarter of 2026 (November 3, 2026)Counterpoint Research
- iPhone hits record third quarter shipment share, reporting Counterpoint (October 12, 2026)9to5Mac
- Smartphone shipments in the third quarter of 2026 (October 14, 2026)IDC
- Apple reports first quarter results (January 29, 2026)Apple Newsroom
- App Store support: iOS 26 and iPadOS 26 usageApple Developer
- 2025 App Store Transparency ReportApple
- The Android Show: I/O Edition 2025 (May 13, 2025)Google
- How Google Play worksGoogle Play
- Android version distribution data for Android Studio (updated October 1, 2026)Google
- Distribution dashboardAndroid Developers
- Meet Google Play's target API level requirementAndroid Developers
- Plan for success on Google Play with Reach and devices (July 13, 2021)Android Developers Blog
- Video: Reach and devices and Android vitals in Play ConsoleAndroid Developers
- Google Play statistics and trends (updated daily)42matters
- iOS App Store statistics and trends (updated daily)42matters
- Number of Android apps on Google PlayAppBrain
- 2026 State of Mobile (January 2026)Sensor Tower
- Summary of Sensor Tower's State of the Mobile Market in 2026 (January 30, 2026)Game Dev Reports
- State of Gaming 2026 (February 2026)Sensor Tower
- App Store gaming revenue hit $52.5B in 2025, reporting Sensor Tower (February 25, 2026)9to5Mac
- Q2 2026 Digital Market Index (August 2026)Sensor Tower
- Q3 2026 Digital Market Index (November 2026)Sensor Tower
- App downloads declined again in 2025 but consumer spending rose, reporting Appfigures (January 14, 2026)TechCrunch
- State of Subscription Apps 2026RevenueCat
- State of Subscription Apps 2026 in 10 minutes (March 19, 2026)RevenueCat
Researched and written by Mark Weizer. Last checked on November 13, 2026.