How to Use the Engagement Rate Calculator Above
The calculator runs in your browser and keeps nothing. It takes the numbers you can read off any post in under a minute, so open the post's insights in another tab before you start.
- Step 1
Pick the Network
Choose the network the post went out on. The field names change to match it: Facebook says reactions instead of likes, Mastodon says favourites and boosts, YouTube asks for subscribers, Telegram asks for views and subscribers. The benchmark under your result also switches to that network, so a LinkedIn post is never judged against a TikTok number.
- Step 2
Type the Interactions
Enter likes, comments, shares and saves, or whatever the network calls them. Leave a box empty if the network does not show that number, and it counts as zero. Do not add your own replies to the comment count: a reply thread where you answered ten people doubles the comments without anyone new engaging.
- Step 3
Choose What to Divide By
Followers, reach, impressions or views. Followers is the number everyone can see, so it is the one to use when you compare yourself with another account. Reach and views come from your own insights and tell you how the people who actually saw the post reacted. The next sections explain when each one is the right choice.
- Step 4
Enter That Number
Type the follower count as it was on the day the post went out if you can, not today's count. For reach, use the unique accounts figure, not impressions. For views, use the number the network shows on the post itself. A post from last year divided by this year's followers looks worse than it was.
- Step 5
Read the Result and the Benchmark
The calculator shows your engagement rate to two decimals, the formula it used with your numbers in it, and the 2026 benchmark for that network and that formula, with the study it comes from. If no study publishes a rate for that combination, it says so instead of inventing one. That happens for Bluesky, Mastodon, Telegram and Discord.
- Step 6
Average Several Posts
One post is noise. Run your last 10 or 20 posts and average the rates, or add up all interactions and divide by the summed reach. The two methods give slightly different answers, and the section on averages below explains which to report.
- Step 7
Or Skip the Typing
If your posts go out through Spreadcast, the Analytics tab already shows followers and interactions for each network, likes, comments, reach and views for each post where the network shares them, and an engagement rate by followers. The calculator is for everything else: a competitor's post, an influencer you are vetting, or an account you have not connected.
How We Researched This
On October 28, 2026 we opened every study and help page this page cites and copied the figures from the pages themselves, not from roundups that quote them. The benchmarks come from four 2026 publications: Socialinsider's 2026 social media benchmarks and its separate Instagram, TikTok and LinkedIn studies, the 2026 Social Media Industry Benchmark Report that Rival IQ now publishes under Quid, and Buffer's State of Social Media Engagement 2026. Follower tier figures for Instagram come from HypeAuditor's benchmark guide, last updated in August 2026.
For the formulas we went to each network's own documentation: Meta's developer pages for Instagram media insights and Threads insights, LinkedIn's content analytics help, Pinterest Analytics help, the TikTok video object, the YouTube Data API, the Mastodon status entity, Telegram's statistics API and the Discord message resource. Those pages say which counts exist. They decide which formula is even possible on a network.
Two warnings from that reading shape the whole page. First, the studies do not agree because they do not measure the same thing: one divides by followers, another by reach, one reports the average, another the median. Second, two of the four label 2025 data as 2026 benchmarks while they wait for a full year of 2026 posts. We say which is which in every row, and the calculator only compares your number with a benchmark built the same way.
This page covers the 11 networks Spreadcast publishes to: Instagram, Facebook, Threads, LinkedIn, Pinterest, TikTok, YouTube, Bluesky, Mastodon, Telegram and Discord. We did not survey anyone and we did not run our own benchmark study. Where a number is ours, it is a made up worked example and labeled as one.
What Is Engagement Rate?
Engagement rate is the share of people who did something with a post: liked it, commented, shared it, saved it, or on some networks clicked it. It is written as a percentage. The top of the fraction is the interactions. The bottom is the group you measure against, which is where all the arguments start.
Raw counts mislead because they grow with audience size. A post with 300 likes on an account of 150,000 followers did worse than a post with 60 likes on an account of 1,500. Dividing by audience puts both on the same scale: 0.2% against 4%. That is the whole point of the metric. It lets a small account and a big one, or this month and last month, be judged by the same yardstick.
What counts as an interaction depends on the network, and the network decides that by what it shows you. Instagram reports likes, comments, shares and saves. Facebook reports reactions, comments and shares. LinkedIn adds clicks to its own figure. Pinterest counts saves, Pin clicks and outbound clicks. YouTube gives likes and comments. Bluesky has likes, reposts, replies and quotes. Mastodon has favourites, boosts and replies. Telegram has views, reactions and forwards. Discord has reactions and replies.
Engagement rate is not reach and it is not growth. A post can reach 20,000 people and convince almost none of them to react, and a post seen by 400 can start a long thread. Track the three side by side: followers for growth, reach or views for distribution, engagement rate for how well the content lands with the people who saw it. Our guide to social media KPIs lays out the full set and how they fit together.
One more trap. Engagement rate rewards content that asks for a reaction, and the networks know it. Meta has demoted posts that beg for likes since 2017. A rate earned by a giveaway or a "comment YES" prompt tells you little about whether your normal posts work. The useful number is the rate on your ordinary posts, tracked over months.
Engagement Rate Formula: Four Ways to Calculate It
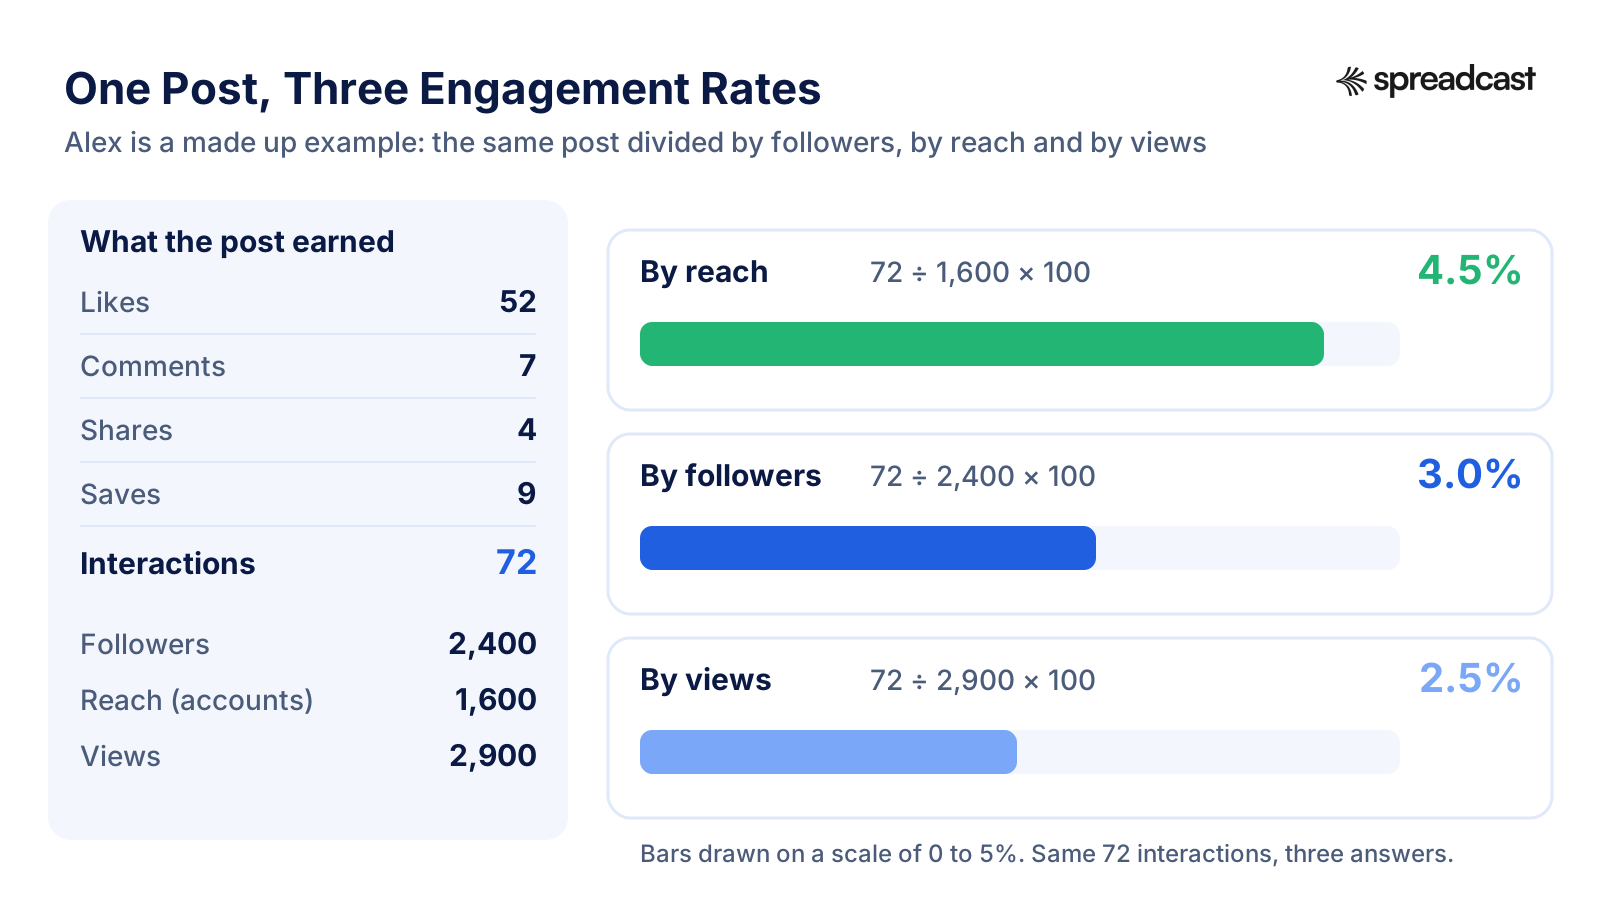
Every engagement rate formula has the same top half, interactions, and one of four bottoms. The example column uses one made up post by Alex: 72 interactions, 2,400 followers, 1,600 accounts reached, 2,900 views and 3,400 impressions.
| Formula | Calculation | What it tells you | Use it when | Alex's post |
|---|---|---|---|---|
| Engagement rate by followers | Interactions ÷ followers × 100 | How much of your audience reacted. Anyone can calculate it for any public account. | Comparing with competitors or influencers, or when the network shows no reach. | 72 ÷ 2,400 × 100 = 3.00% |
| Engagement rate by reach | Interactions ÷ accounts reached × 100 | How the people who actually saw the post reacted, followers or not. | Judging the content itself, on your own account, where reach is available. | 72 ÷ 1,600 × 100 = 4.50% |
| Engagement rate by impressions | Interactions ÷ impressions × 100 | Reaction per time shown, so repeat views by one person count again. | LinkedIn and Pinterest, where impressions are the native figure. | 72 ÷ 3,400 × 100 = 2.12% |
| Engagement rate by views | Interactions ÷ views × 100 | Reaction per play or per display. The norm for video. | TikTok, YouTube, Reels and Telegram, where views are on every post. | 72 ÷ 2,900 × 100 = 2.48% |
Same post, four answers between 2.12% and 4.50%. None is wrong. A benchmark only means something next to a result built with the same formula.
One Post, Three Engagement Rates
The same example drawn as a picture. The interactions never change. Only the bottom of the fraction does, and the rate moves by almost half.
How to Calculate Engagement Rate by Hand, Step by Step
Start by writing down the interactions for one post. On Alex's post that is 52 likes, 7 comments, 4 shares and 9 saves. Add them: 72. If a network shows a combined figure, Instagram's API for example has a total interactions metric that already nets out unlikes and deleted comments, use that figure rather than adding the parts yourself.
Next, pick the bottom of the fraction and write down where you got it. For a follower based rate, that is 2,400. Divide: 72 ÷ 2,400 = 0.03. Multiply by 100 to turn it into a percentage: 3.00%. For a reach based rate, divide by 1,600 instead and you get 4.50%. Keep two decimals. On Instagram and Facebook most brand accounts land below 1% by followers, and the difference between 0.31% and 0.38% matters there.
To get the engagement rate across several posts, you have two choices. The first is to calculate each post's rate and take the average. The second is to add up all interactions and divide by the sum of the bottoms. Say Alex's next post earned 20 interactions from a reach of 400. Averaging the two rates gives (4.50% + 5.00%) ÷ 2 = 4.75%. Pooling gives 92 ÷ 2,000 = 4.60%. Pooling weights big posts more. Averaging treats every post as one vote, which is how the studies report a typical post.
Then decide between average and median. One viral post pulls an average up for months. The median, the middle post when you sort them, ignores it. Rival IQ and Buffer both report medians for that reason, Socialinsider reports averages. If your own rate is calculated as an average and you compare it with a median benchmark, you will look better than you are whenever you had one big hit.
Last, fix the time window. Interactions keep arriving long after posting on some networks, search driven ones like Pinterest and YouTube especially, so a post measured after one day looks worse than the same post after a week. Pick one window, such as seven days after posting, and stick to it. Spreadcast's Analytics uses the first week of interactions for its engagement rate for exactly this reason: a post from yesterday and a post from last month are then measured over the same stretch.
If you track this in a sheet, put one row per post with the date, network, format, each interaction type, followers on that day, reach and views. The template in our social media audit template has those columns ready, and the content calendar shows how to link each row back to what you planned.
Engagement Rate by Followers vs by Reach: Which One to Use
Use followers when you compare accounts. It is the only bottom you can read from the outside, so it is how every public benchmark of brands works, and how you vet a creator before paying them. Its weakness is that most of your followers never see a given post. The bigger the account, the smaller the share that sees each post, so follower based rates fall as accounts grow, whatever the content quality.
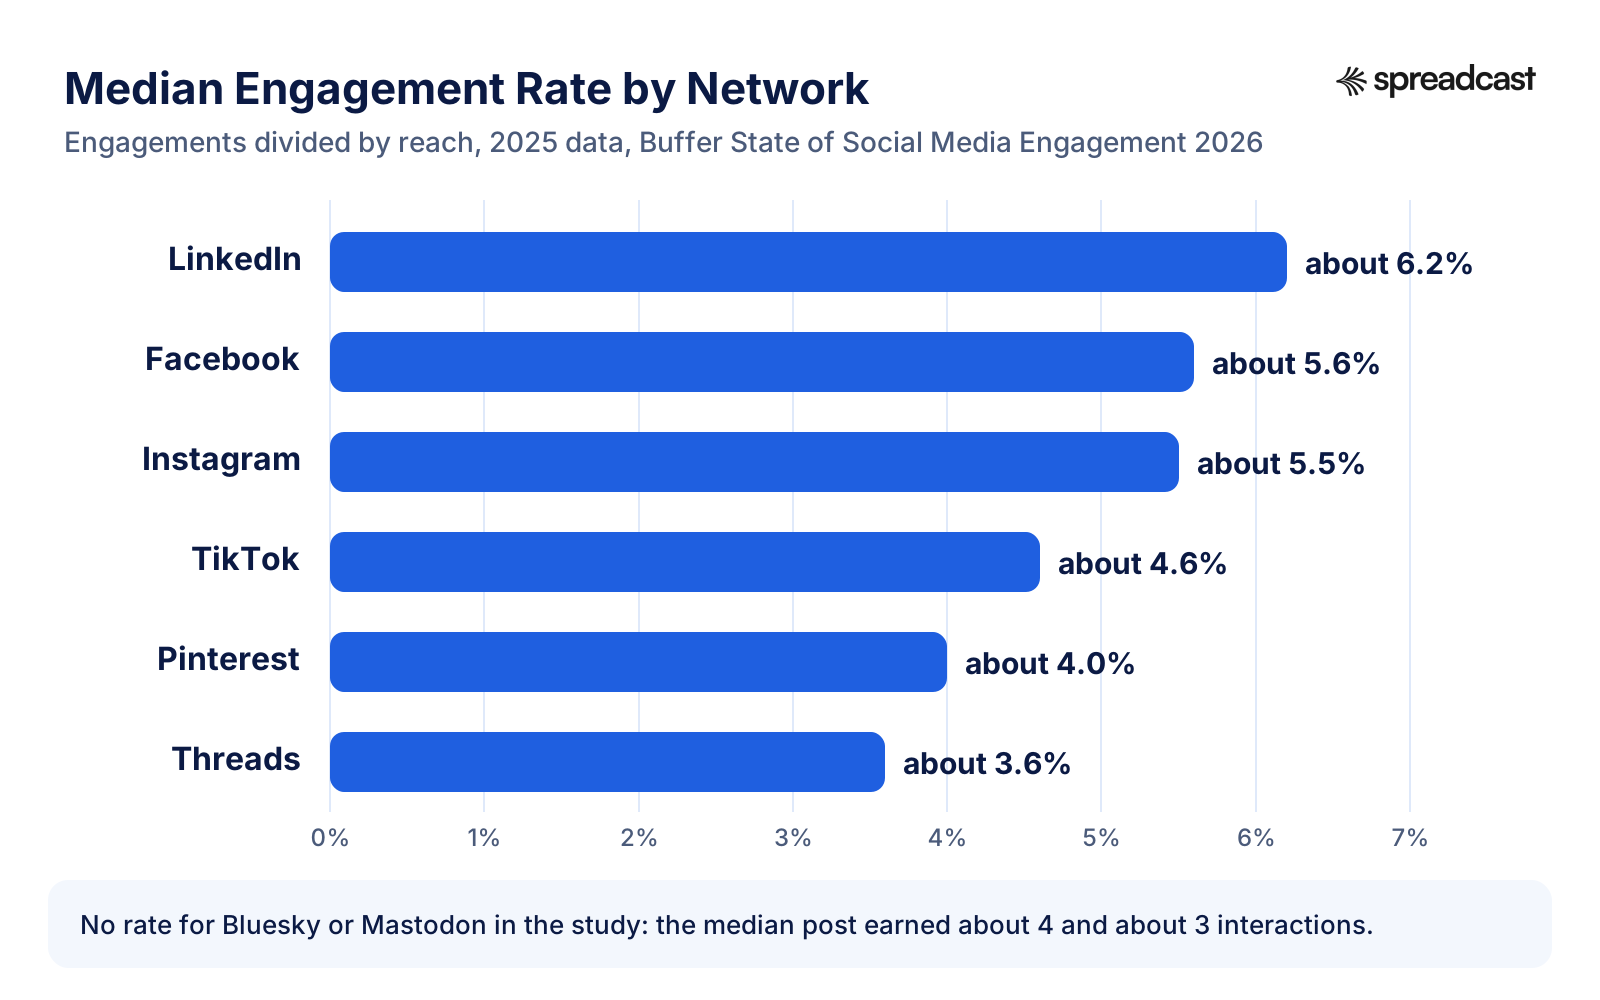
Use reach when you judge your own content. It divides by the people who saw the post, followers and strangers alike, so a post that travelled far outside your audience is not punished for it. Buffer's 2026 report uses reach for exactly that reason and gets rates ten times higher than the follower based studies: about 5.5% on Instagram against 0.30% to 0.45%. Both are right. They answer different questions.
Use impressions or views when that is what the network gives you. LinkedIn's own engagement rate is interactions per impressions. Pinterest's is engagements divided by the times your Pins were seen. TikTok and YouTube show views on every video, and the video studies divide by views. On a network that shows views but not reach, a view based rate is the closest thing to a reach based rate you can get.
Some networks leave you only followers. Bluesky and Mastodon show no view counts on posts, and Discord messages carry reaction counts but no views. On those three, divide by followers or members, or simply track interactions per post, which is what Buffer does for Bluesky and Mastodon.
Whatever you pick, write it next to the number every time. "Engagement rate 4.2%" means nothing on a report. "4.2% by reach, median of 18 posts, first seven days" can be compared with next month and with a benchmark built the same way.
Engagement Rate Formula for Each Network
What each of the 11 networks counts, which bottom it supports, and the formula the calculator uses when you pick it. Checked against each network's documentation on October 28, 2026.
| Network | Interactions the network shows | Bottoms available | Formula the calculator uses |
|---|---|---|---|
| Likes, comments, shares, saves. Meta's media insights also give reach and views for feed posts and Reels. | Followers, reach, views | (likes + comments + shares + saves) ÷ followers, reach or views × 100 | |
| Reactions, comments, shares. Meta is replacing impressions with views as its distribution metric. | Followers, reach, views | (reactions + comments + shares) ÷ followers, reach or views × 100 | |
| Threads | Likes, replies, reposts, quotes, and views (marked in development) in Threads insights. | Followers, views | (likes + replies + reposts + quotes) ÷ followers or views × 100 |
| Reactions, comments, reposts, clicks. LinkedIn's own rate is interactions per impressions. | Impressions, members reached, followers | (reactions + comments + reposts, plus clicks if you want LinkedIn's figure) ÷ impressions or followers × 100 | |
| Saves, Pin clicks, outbound clicks. Pinterest's own rate divides by impressions. | Impressions, followers | (saves + Pin clicks + outbound clicks) ÷ impressions or followers × 100 | |
| TikTok | Likes, comments, shares, views in the video object. Saves show in the app. | Views, followers, reach | (likes + comments + shares + saves) ÷ views, followers or reach × 100 |
| YouTube | Likes and comments in the Data API. Dislikes are private. Shares show in YouTube Studio. | Views, subscribers | (likes + comments + shares) ÷ views or subscribers × 100 |
| Bluesky | Likes, reposts, replies, quotes. No view count on posts. | Followers | (likes + reposts + replies + quotes) ÷ followers × 100 |
| Mastodon | Favourites, boosts, replies, quotes, per the status entity. No view count. | Followers | (favourites + boosts + replies) ÷ followers × 100 |
| Telegram | Views, forwards, reactions, comments if a discussion group is linked. Channel stats give views and shares per post. | Views, subscribers | (reactions + forwards + comments) ÷ views × 100, and a view rate: views ÷ subscribers × 100 |
| Discord | Reactions and replies. The message object has reaction counts and no views. | Members | (reactions + replies) ÷ server members × 100 |
Where a network shows a total that already nets out removed likes, such as Instagram's total interactions, the calculator accepts it in place of the separate boxes.
Instagram Engagement Rate Calculator: Formula and Average Engagement Rate on Instagram
Most people who search for an engagement rate calculator want the Instagram one. The formula is (likes + comments + shares + saves) ÷ followers × 100 for a public comparison, or the same top divided by reach for your own posts. Meta's documentation lists likes, comments, shares and saved for feed posts and Reels, plus reach, which it describes as unique accounts that saw the media, and views. It also says impressions are deprecated for media created after July 2, 2024, so a calculator that still asks you for impressions on a new post is out of date.
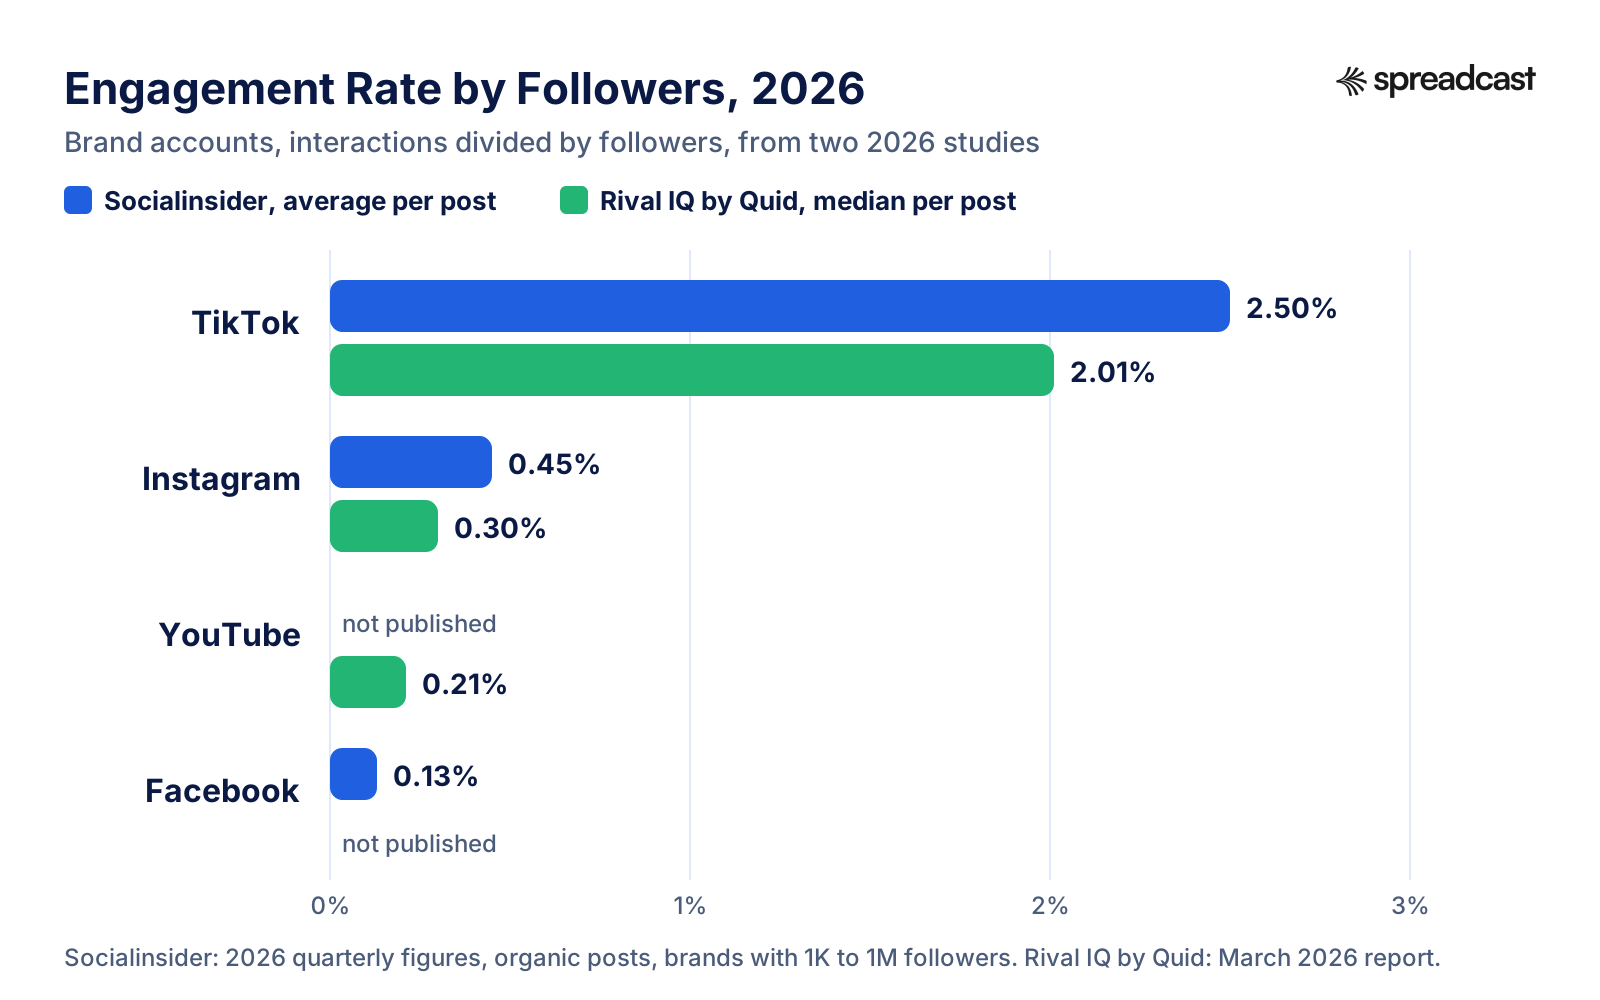
So what is the average engagement rate on Instagram in 2026? By followers, Socialinsider's Instagram study puts the average brand post at 0.48% for 2025 and its third quarter 2026 update at 0.45%, counting likes and comments over followers across 67.5 million posts from accounts with 1,000 to 1 million followers. Rival IQ's report puts the median at 0.30%, down from 0.36% a year earlier. By reach, Buffer's median is about 5.5%. Those three numbers describe the same network.
Format matters more than most tips suggest. In Socialinsider's data, carousels averaged 0.55% by followers in 2025 and 0.50% in the third quarter of 2026, Reels 0.52% and 0.48%, single images 0.37% and 0.35%. Buffer, measuring by reach, found carousels at a 6.90% median, single images at 4.44% and Reels at 3.31%. Reels win on reach instead: Buffer found they reach about 36% more people than carousels and about 125% more than single images. A carousel is the engagement play; a Reel is the discovery play.
For creators the numbers run higher because their followers chose them personally. HypeAuditor's guide, updated in August 2026, gives rough ranges of 4% to 5% for accounts with 1K to 5K followers, down to 1% to 2% above 500K, and puts brand accounts at roughly 0.5% to 1%. HypeAuditor divides likes plus comments by views rather than followers, so read those as view based figures.
When you vet an influencer, compare their follower based rate with the tier, look at the comments for real sentences rather than emoji strings, and check whether the rate holds across their last 20 posts or rests on two. A tenfold gap between one post and the rest usually means a giveaway or a paid push. Our guide to promoting an app on Instagram covers the creator side in more depth, and the Instagram post generator shows the sizes and caption limits that carousel posts need.
Engagement Rate Calculator for TikTok
TikTok is a video network, so the standard TikTok engagement rate divides by views: (likes + comments + shares + saves) ÷ views × 100. TikTok's developer video object carries like, comment, share and view counts for every video, and the app shows saves beside them. A follower based rate also works and is what you will see in brand benchmarks, but on TikTok most views come from people who do not follow you, so dividing by followers can produce rates above 100% on a video that travels.
By views, Socialinsider's TikTok study, published in April 2026 from 40.7 million organic videos, puts the average at 3.85% for the first half of 2026 and 3.90% in the third quarter. By followers, its main benchmarks page lists TikTok at 2.50% for 2026, down from 3.70% for 2025, and Rival IQ's median is 2.01%. Buffer's median by reach is about 4.6%. TikTok still leads every network on follower based engagement in both brand studies.
Account size barely moves TikTok's view based rate, which is unusual. Socialinsider's 2025 figures by page size run from 4.40% for accounts under 5K followers to 3.75% for 50K to 100K, and back up to 3.95% above 100K. A small account is not at a disadvantage there, because the For You feed hands each video to strangers first.
When you use the calculator for TikTok, pick views as the bottom unless you are comparing yourself with a brand benchmark by followers. Count saves: on TikTok a save often means "I want to try this later", the strongest signal you get from a how to video. And give the video three to five days before you judge it, so the slower views and saves are counted too.
If you make videos for an app, our guide to promoting an app on TikTok explains which formats earn saves and shares rather than passive views.
Video: TikTok on Sound and Engagement
A one minute tip from TikTok's own business channel. It is short and old, but the point holds: on TikTok, sound is part of the content, and videos built with sound in mind earn more interactions.
Engagement Rate Calculator for LinkedIn and the Average Engagement Rate on LinkedIn
LinkedIn calculates engagement rate for you on Company Page posts, and it uses impressions. Its content analytics help page defines engagement rate as the ratio of interactions per impressions, and counts clicks on your content, company name or logo among them. It also warns that impressions are an estimate, and that metrics can take 48 hours to show, except reactions and comments, which update at once. A LinkedIn engagement rate calculator earns its keep when all you have are the counts, such as a competitor's post or an export from a tool that leaves the rate out.
The formula, then, is (reactions + comments + reposts + clicks) ÷ impressions × 100 if you want to match LinkedIn's figure, or the same without clicks if you want to match the studies. Clicks are often the biggest number on a LinkedIn post, so including them or not changes the result a lot. The calculator has a separate box for clicks so you can do either.
The average engagement rate on LinkedIn in 2026 is higher than on any other network on an impressions or reach basis. Socialinsider's LinkedIn study, published in March 2026 from 2.45 million organic posts by pages with 1K to 1M followers, puts the average at 5.20%, counting reactions, comments and shares over impressions. Buffer's median, which includes clicks, is about 6.2%, the top of its table.
Format is where LinkedIn gets interesting. Socialinsider's 2025 averages by impressions: native documents, the PDF carousels, 7.00%; multi image posts 6.45%; video 6.00%; single images 5.30%; plain text 4.50%; polls 4.20%; posts with a link 3.25%. A link post earns about half the rate of a document post. If you share an article, put the link in the first comment and keep the post itself as a document or an image.
For carousel specs and examples that work, see LinkedIn carousel size and our LinkedIn carousel examples. The LinkedIn post generator covers the caption side, including where the "see more" cut falls.
Engagement Rate on YouTube: Formula, Views and Subscribers
The usual YouTube engagement rate is (likes + comments) ÷ views × 100, with shares added if you read them from YouTube Studio. The public YouTube Data API gives view, like and comment counts for every video. Dislikes have been private since December 13, 2021, so they cannot be part of a public formula. YouTube's help page on engagement adds that like counts in Analytics can differ from the watch page and can drop as invalid likes are removed.
Views changed meaning recently, which matters for anyone comparing old and new rates. YouTube's help now says views are counted the moment a video starts to play, across Shorts, long videos and live streams, and the Data API notes that from August 24, 2026 the public view count follows the same rule. More plays count as views, so the same likes divided by a bigger view count give a lower rate. A drop in your YouTube engagement rate around that date may be an accounting change, not a content problem.
Benchmarks for YouTube are thin. Rival IQ added YouTube to its 2026 report for the first time and found a median engagement rate of 0.21% by subscribers across industries, with Food far ahead and Tech and Financial Services trailing. Buffer does not publish a YouTube rate at all. It reports the median video it publishes earned 433 views. No study we checked publishes a view based YouTube rate for 2026, so the calculator shows the subscriber benchmark only.
For Shorts, treat YouTube like TikTok: divide by views, wait a few days, and look at shares and comments over likes. For long videos, engagement rate is a weak signal next to watch time and average view duration, which YouTube's own analytics put first. A tutorial watched to the end with few likes is doing its job.
Video: Reading YouTube Analytics in Four Steps
YouTube's own Creator Insider team walks through a quick channel check in YouTube Studio, including where the engagement numbers live.

Engagement Rate on Facebook
On Facebook the interactions are reactions, comments and shares, and the formula is (reactions + comments + shares) ÷ followers × 100 for a public comparison, or divided by reach for your own Page. Count every reaction type, not only likes: a love or a haha is the same act of engaging.
Facebook has the lowest follower based engagement of the big networks. Socialinsider's benchmarks put the average brand post at 0.15% for 2024 and 2025 and 0.13% in the third quarter of 2026. Rival IQ calls Facebook engagement flat and does not print a median on its page. By reach the picture flips: Buffer's median is about 5.6%, second only to LinkedIn. People who see a Facebook post react to it about as often as on Instagram. Far fewer of your followers get to see it.
Meta's measurement is also moving. As Social Media Today reported in August 2025, Meta is deprecating the impressions metric in its Page insights API and replacing it with views, which it wants as the single distribution metric across Facebook and Instagram. If an older report used impressions as the bottom, recalculate it with views before comparing.
Do not chase the rate with bait. Meta began demoting posts that ask people to like, comment or share in 2017, extended it to comments and to video audio later, and says Pages that do it repeatedly face stronger demotion. A higher rate that costs you reach is a bad trade.
Engagement Rate on Threads, Pinterest, Bluesky, Mastodon, Telegram and Discord
The networks most calculators skip. Each one counts differently, and on three of them there is no public rate benchmark at all, so you are your own baseline.
Threads Engagement Rate
Threads insights give likes, replies, reposts and quotes for each post, plus views and shares, which Meta still marks as in development. Use (likes + replies + reposts + quotes) ÷ followers, or divide by views on your own posts. Buffer's median for Threads is about 3.6%, down about 18% from the year before. Threads is a conversation network: Buffer found posts where the account replied to comments earned about 42% more engagement, the biggest lift of any network. More numbers in our Threads statistics.
Pinterest Engagement Rate
Pinterest defines it for you: total engagements divided by the number of times your Pins were seen. Engagements include saves, Pin clicks that open the closeup, and outbound clicks to your site. Buffer's median is about 4.0%, up from about 3.2% a year earlier. Pins earn interactions for months, so measure over 30 days, not seven. See Pinterest for app founders for what makes people save a Pin.
Bluesky Engagement Rate
Bluesky shows likes, reposts, replies and quotes on every post and no view count, so the only rate is by followers: (likes + reposts + replies + quotes) ÷ followers × 100. No study publishes a Bluesky rate. Buffer reports the median post earned about 4 interactions in 2025, a little down from about 5. For a small account that is the more honest yardstick. Our Bluesky user numbers give the context.
Mastodon Engagement Rate
The Mastodon status entity counts favourites, boosts, replies and accepted quotes, and has no views. Divide by followers. Buffer's median held at about 3 interactions per post through 2025. Because Mastodon has no algorithmic feed, boosts are how a post travels, so weigh them above favourites when you compare two posts.
Telegram Channel Engagement Rate
Telegram channels show a view counter on every post and no likes by default, so the core number is a view rate: views ÷ subscribers × 100. Add reactions, forwards and comments over views for an interaction rate. Telegram's channel FAQ says view counts include forwarded copies, are approximate, and count a person again if they return after about four days. Built in statistics show views and shares per post for channels of a certain size; Telegram's 2020 announcement set the bar at channels with more than 50 subscribers, and the API documentation now calls the limit a server side setting. More in how to grow a Telegram channel.
Discord Engagement Rate
A Discord announcement has reactions and replies and nothing else: the message object counts reactions per emoji, including super reactions, and has no view count. Divide reactions plus replies by server members for a rough rate, and expect it to be low on big servers where most members are idle. Track it per announcement over time rather than against anyone else's server.
Video: Pinterest on Measuring Audience Engagement
Pinterest's own channel, in a series made with Canva, walks through the analytics dashboard: where impressions, saves and clicks live and how to read them.

Posting to the Networks Most Tools Skip
If you read the last cards and thought "we should be on Threads and Bluesky, but nobody has time for four more feeds", that is the usual reason those accounts sit empty. Every extra network means another caption length, another image size, another app to open at nine in the morning.
Spreadcast publishes to all 11 networks on this page from one calendar: Instagram, Facebook, Threads, LinkedIn, Pinterest, TikTok, YouTube, Bluesky, Mastodon, Telegram and Discord. It designs the image in your brand and writes a caption for each network that fits its limits, so a post goes to Threads, Bluesky and a Telegram channel in the same pass as Instagram. Pro is $29 a month for 10 social accounts in any mix, and the pricing page lists what each plan includes.
Social Media Engagement Rate Benchmarks 2026 by Network
Every figure we could verify on the publisher's own page on October 28, 2026, by network and by formula. Read across a row to see how far the formula moves the number.
| Network | By followers | By reach, impressions or views | Where the figures come from |
|---|---|---|---|
| 0.45% average (third quarter 2026); 0.30% median | About 5.5% median by reach | Socialinsider, Rival IQ by Quid, Buffer | |
| 0.13% average (third quarter 2026) | About 5.6% median by reach | Socialinsider, Buffer | |
| TikTok | 2.50% average; 2.01% median | 3.90% average by views (third quarter 2026); about 4.6% median by reach | Socialinsider, Rival IQ by Quid, Socialinsider TikTok study, Buffer |
| No 2026 study publishes one | 5.20% average by impressions; about 6.2% median including clicks | Socialinsider LinkedIn study, Buffer | |
| YouTube | 0.21% median by subscribers | No 2026 rate published; Buffer's median video had 433 views | Rival IQ by Quid, Buffer |
| No 2026 study publishes one | About 4.0% median by reach or impressions | Buffer | |
| Threads | No 2026 study publishes one | About 3.6% median by reach | Buffer |
| Bluesky | No rate published; median post about 4 interactions | No views exist | Buffer |
| Mastodon | No rate published; median post about 3 interactions | No views exist | Buffer |
| Telegram | No study we could verify | No study we could verify | Use your own median view rate |
| Discord | No study we could verify | No views exist | Use your own median per announcement |
Socialinsider: brands with 1K to 1M followers, organic posts, averages; it labels 2025 values as 2026 and adds quarterly updates. Rival IQ by Quid: 150 companies in each of 18 industries, medians, organic and paid posts, March 2026. Buffer: 52 million posts, medians, 2025 data published March 2026.
Median Engagement Rate by Network, Measured by Reach
Buffer's medians, the only 2026 source that puts six of these networks on one formula. LinkedIn, Facebook and Instagram sit close together at the top; Threads is at the bottom.
Engagement Rate by Followers in Two 2026 Studies
The follower based view, from the two brand studies. Same networks, numbers a tenth the size, and TikTok far ahead of the rest.
Why Engagement Rate Benchmarks Disagree
Put the studies side by side and Instagram's average engagement rate is 0.30%, 0.45% or 5.5%, depending on whom you ask. None of them is wrong. Four choices explain almost all of the gap.
The bottom of the fraction. Socialinsider and Rival IQ divide by followers. Buffer divides by reach. Socialinsider's LinkedIn and TikTok studies divide by impressions and views. Reach is always smaller than followers on a brand account, so reach based rates are always higher, roughly ten times on Instagram and Facebook.
Average or median. Socialinsider reports averages, which a handful of viral posts can lift. Rival IQ and Buffer report medians, the typical post. Expect averages to sit above medians.
Who is in the sample. Socialinsider covers brand accounts with 1,000 to 1 million followers. Rival IQ picks 150 companies at random in each of 18 industries, from a database of over 200,000, and includes paid posts. Buffer's data comes from accounts that publish through Buffer and posted at least 10 times in the past year, across at least four different weeks. Different accounts, different results.
Which interactions count. Socialinsider counts only likes and comments on Instagram, while Buffer and Meta's own total add shares and saves. On LinkedIn, Buffer's figure includes clicks and Socialinsider's does not. More counted interactions, higher rate.
The practical rule: compare your number only with a benchmark built the same way, and trust your own trend over any study. If your median rate by reach went from 3% to 4% over a quarter, that is real progress, whatever a report says the network average is. For the bigger picture behind these numbers, our social media statistics page collects user and usage data for each network.
What Is a Good Engagement Rate by Follower Tier?
Smaller accounts earn higher rates on almost every network. These are the only 2026 tier figures we could verify on the publisher's page. Both divide by views.
| Followers | Instagram, by views | TikTok, by views (2025) |
|---|---|---|
| Under 5K | 4% to 5% (1K to 5K) | 4.40% |
| 5K to 10K | About 2.5% to 3.5% (5K to 50K) | 4.00% |
| 10K to 50K | About 2.5% to 3.5% (5K to 50K) | 3.90% |
| 50K to 100K | About 2% to 2.5% (50K to 500K) | 3.75% |
| Over 100K | About 2% to 2.5% up to 500K, about 1% to 2% above | 3.95% |
Instagram: HypeAuditor's rough ranges for creators, likes plus comments divided by views, updated August 7, 2026; it puts brand accounts at about 0.5% to 1%. TikTok: Socialinsider's TikTok study, likes, comments, shares and saves divided by views, published April 22, 2026.
What Is a Good Engagement Rate?
A good engagement rate is one above the typical post on the same network, measured the same way, for accounts of your size. That sounds like a dodge, but it is the only definition that survives contact with the studies above. 1% by followers is excellent on Facebook and below par on TikTok. 3% by reach is poor on LinkedIn and fine on Threads.
Here is a workable shorthand for brand accounts, built from the 2026 figures. By followers: above 0.5% on Instagram is good, above 0.2% on Facebook is good, above 2.5% on TikTok is good. By reach: above 5% on Instagram, Facebook or LinkedIn is good, above 4% on TikTok or Pinterest is good, above 3.5% on Threads is good. Creators can expect more, and a rule like "anything above 1%" for Instagram creators is too low to mean anything.
Is 2% a good engagement rate? On Instagram by followers, yes, about four times the brand average. On TikTok by followers, it is about the median. By reach on any network, it is below the typical post. Is 10% good? By followers on Instagram it is unusual enough to check for a giveaway or bought engagement. By reach on a small account it happens on posts that hit a nerve.
Then there is the better question: good compared with what you did last month? Benchmarks help you notice if something is badly off. Your own median, tracked over months on a fixed formula, tells you whether the work is improving. Most teams that track engagement well look at one number per network per month and one line of notes on what changed.
A good rate on the wrong goal is still the wrong goal. If you post to drive app installs, sign ups or sales, engagement rate is a leading signal, not the result. Put it next to clicks to your link and followers gained, and judge the posts by the business number when you have one.
How to Increase Your Engagement Rate
Tactics with evidence behind them, from the studies above and the networks' own explanations of their ranking. No engagement bait.
Reply to Comments
Buffer compared posts where the account replied to comments with posts where it did not. Replied posts earned more engagement on every network it checked: about 42% more on Threads, 30% on LinkedIn, 21% on Instagram, 9.5% on Facebook and 5% on Bluesky. Buffer is careful to say the direction of cause is unclear. Replying is still the cheapest test on this list.
Use Carousels on Instagram and Documents on LinkedIn
On Instagram, carousels earned the highest rate in both Socialinsider's follower data and Buffer's reach data. On LinkedIn, native documents averaged 7.00% by impressions against 3.25% for link posts. Swipeable formats give people a reason to stop and a reason to save. Our carousel prompts are a quick way to draft the slides.
Post Every Week, Without Gaps
Buffer found that accounts which skipped a week underperformed their own baseline growth, which it calls the no post penalty, and that its top accounts post more often than the median. Consistency is the part that breaks first when one person does marketing on the side. Spreadcast can keep the feed going on its own: paste your App Store link or website at /start and it designs on brand posts and publishes them on a schedule, on full autopilot or after one tap of approval.
Design for the Signals the Network Ranks By
Instagram's head Adam Mosseri explained in 2023 that Feed ranking leans on how likely you are to spend a few seconds on a post, comment, like, share or tap the profile, and Reels ranking on whether you reshare, watch to the end and like. Saves and shares come from posts worth keeping or sending: a checklist, a before and after, a number people will quote. See what makes a social post good.
Ask a Real Question, Never Bait
A specific question in the caption, one the reader has an opinion on, gets comments. "Comment YES if you agree" gets demoted on Meta's networks and teaches the algorithm your audience reacts to nothing else. Ask the question you would ask a customer on a call.
Write the Caption for Each Network
The same caption pasted everywhere reads wrong on half the networks: too long for Bluesky's 300 characters, too bare for LinkedIn, a link that cannot be clicked in an Instagram caption. Our character limits for every network list the fields, and the caption generator drafts one per network.
Keep the Brand Recognizable
People engage faster with posts they recognize as yours before they read the name. Same colors, same fonts, same layout for the same kind of post. Brand consistency without a design team explains how small teams keep it without a designer.
Test One Change at a Time
Change one thing per batch of posts, the format, the first line or the hour, and compare the median rate of the next eight to ten posts with the eight to ten before. Rival IQ's medians, about 3.7 posts a week on Instagram, about 3 on Facebook and about 2 on TikTok, show how few posts a typical brand has to learn from each week, so a single post proves nothing either way.
Common Mistakes When You Calculate Engagement Rate
Counting your own replies. A comment thread where you answered every person doubles the comment count. Either subtract your replies or count unique commenters. The calculator assumes you entered other people's interactions only.
Using today's follower count for old posts. An account that grew from 2,000 to 6,000 followers this year will see its January posts drop to a third of their real rate if you divide them by today's number. Note the follower count when you post, or use reach, which is fixed per post.
Mixing paid and organic. A boosted post reaches people outside your audience on a budget, and its reach and interactions mix into the post's totals. Report organic and paid separately, and compare organic posts only with organic benchmarks such as Socialinsider's. Rival IQ includes paid posts in its sample, which is one more reason its figures and Socialinsider's differ.
Comparing across formulas. A 4% rate by reach next to a 0.4% competitor rate by followers is not a win. Run the competitor's public numbers through the calculator by followers first.
Including giveaway posts in the average. A contest with "tag three friends" can show ten times your normal rate. Leave it out of the median or mark it, or it will hide what your ordinary posts are doing.
Ignoring counting changes. Instagram's API stopped reporting impressions for posts made after July 2, 2024, Meta is moving Facebook to views, and YouTube changed when a view counts in 2026. A sudden jump or fall in your rate around one of those dates is worth checking against the network's change log before you change your content plan.
Ignoring bots. An account that bought followers has a low rate by followers and a suspicious pattern of short comments. If you vet influencers, the rate is a quick filter, not proof. Look at who is commenting.
How to Check a Competitor's or an Influencer's Engagement Rate
From the outside you only see what the network makes public, and that decides the formula. Reach, saves and impressions are private on every network, so a competitor's engagement rate is always by followers, and on Instagram it is likes plus comments over followers. That is also why Socialinsider's Instagram benchmark counts only likes and comments: it is the version anyone can reproduce.
Open the account and take its last 12 regular posts. Skip anything from the last two days, because those are still collecting interactions. Skip pinned posts, which sit at the top for months and keep gathering likes. Skip giveaways and posts that say paid partnership, or note them separately. Write down likes and comments for each, and the follower count once.
Run each post through the calculator by followers, then sort the 12 rates and take the middle two. That median is the account's typical post. Compare it with your own median, built the same way from your own public numbers, not with your reach based rate from insights. If the account hides like counts, which Instagram lets people do, you only have comments, and the honest answer is that you cannot compare.
On TikTok and YouTube the views are public, so you can work out a view based rate for any video: likes plus comments, plus shares where the app shows them, divided by views. On LinkedIn you can see reactions, comments and reposts but not impressions, so use followers. On Bluesky and Mastodon the counts are on every post, and followers on the profile.
Then read the comments. A real audience writes sentences, asks questions and argues. A rate propped up by bought engagement shows the same short comments from accounts with no posts of their own, often within minutes of posting. If you are about to pay a creator, ask for a screenshot of reach and saves from their own insights for three recent posts. Anyone serious will send it.
How to Track Engagement Rate Without a Spreadsheet
Here is what tracking engagement by hand looks like for a small team posting to four networks. Once a week someone opens Instagram insights, LinkedIn page analytics, the Threads app and Pinterest analytics, copies likes, comments, shares, saves, reach and followers for each post into a sheet, fixes the rows where a number was missed, and works out the rates. That is an hour a week for a handful of posts, and it is the first task skipped when things get busy. The posting itself takes longer: an image designed per post, a caption per network, each one uploaded by hand.
Here is what it looks like in Spreadcast. Posts are designed in your brand and published to Instagram, Facebook, Threads, LinkedIn, Pinterest, TikTok, YouTube, Bluesky, Mastodon, Telegram and Discord from one calendar. The Analytics tab then shows followers and interactions for each network and likes, comments, reach and views for each post where the network shares them, with an engagement rate by followers worked out from each post's first week. Nobody copies a number into a sheet.
For an app, the posts can start themselves. Spreadcast checks your App Store listing every day, and when a new version goes live or the app hits a ratings milestone, it designs the post, writes a caption per network and publishes it on full autopilot or after one tap of approval. For anything else you type one line in Create, or pick one of twelve post types for apps, such as a testimonial, a how to or a feature post, and it designs a single image or a carousel. You can also upload your own pictures and video and schedule them.
If you work in Claude or ChatGPT, the Spreadcast MCP server lets the assistant read your analytics, design posts and carousels, write captions, and create, schedule and approve posts from the chat. Ask it which posts beat your median rate last month and to draft three more like them.
Pricing is plain. Free makes 3 posts to download for one app, with a small Spreadcast mark. Pro is $29 a month or $290 a year for clean posts with no cap, publishing to 10 social accounts in any mix, autopilot or one tap approval, and posting from Claude or ChatGPT. Studio is $79 a month for 5 apps and 50 accounts, each with its own brand. If you only need a burst, a Post Pack is $19 once for 10 posts designed and published, and a 30 Day Pass is $39 once for everything in Pro for 30 days. Paid plans have a 7 day full refund. Paste your link at spreadcast.app/start to see the first posts before you pay.
Where Engagement Rate Fits in Your Reporting
Engagement rate earns its place as the quality check between reach and results. Reach and views say whether the network showed the post. Engagement rate says whether the people who saw it cared. Follower growth, link clicks and the business number at the end say whether it paid off. A monthly report with those four lines per network, plus a sentence on what you changed, beats a dashboard with forty metrics nobody reads.
Keep the formula fixed for the whole year. If you switch from followers to reach in June, the line jumps and the comparison with the first half of the year is gone. If the network forces a change, as Meta did with views, note it on the report the month it happens.
Use the benchmarks twice a year, not every week. Check whether you are roughly in line with your network and size, then go back to beating your own median. And when a post does far better than usual, look at why before you celebrate the number: the format, the topic, the hour, the first line. That note is worth more than the rate. If you want ideas for the next batch, our list of 52 post ideas for an app and the guide to batching a month of content in one afternoon are good places to start.
Frequently Asked Questions
How do you calculate engagement rate?
Add up the interactions on a post, such as likes, comments, shares and saves, divide by followers, reach or views, and multiply by 100. 72 interactions on an account of 2,400 followers is 72 ÷ 2,400 × 100 = 3%. Say which bottom you used, because the same post gives a different rate by reach or by views.
What is a good engagement rate?
One above the typical post on the same network, measured the same way. By followers, brand accounts average about 0.30% to 0.45% on Instagram, 0.13% on Facebook and 2% to 2.5% on TikTok in the 2026 studies. By reach, typical posts sit around 3.6% on Threads to 6.2% on LinkedIn.
What is the average engagement rate on Instagram?
For brand accounts in 2026, about 0.45% by followers in Socialinsider's data and a 0.30% median in Rival IQ's. Measured by reach, Buffer's median is about 5.5%. Carousels earn the highest rate of any Instagram format in both kinds of study.
Is engagement rate calculated by followers or reach?
Both are used. Followers is the public number and the one to use when comparing accounts. Reach counts only people who saw the post, so it is better for judging your own content and gives rates roughly ten times higher on Instagram and Facebook.
How do I calculate engagement rate on TikTok?
Divide likes, comments, shares and saves by views and multiply by 100. Socialinsider puts the average brand video at about 3.9% by views in 2026. If you divide by followers instead, the brand benchmarks are 2.01% to 2.50%.
How is LinkedIn engagement rate calculated?
LinkedIn divides interactions, including clicks, by impressions. Its help page calls it the ratio of interactions per impressions. Socialinsider's 2026 average without clicks is 5.20%, and Buffer's median with clicks is about 6.2%.
What is a good engagement rate on YouTube?
Rival IQ's 2026 report found a median of 0.21% by subscribers across industries. By views, likes plus comments of a few percent is common, but no 2026 study we checked publishes a view based figure, so compare with your own median.
Is 2% a good engagement rate?
On Instagram or Facebook by followers, yes, well above the brand averages. On TikTok by followers it is about the median. By reach on any network it is below the typical post.
How do you calculate average engagement rate for multiple posts?
Work out each post's rate and take the average or the median, or add all interactions and divide by the summed reach. The median is the safest choice because one viral post cannot skew it.
Where These Facts Come From
Every outside number, rule and price on this page links to the page it was taken from.
- 2026 social media benchmarksSocialinsider
- Instagram benchmarks 2026Socialinsider
- TikTok benchmarks 2026Socialinsider
- LinkedIn benchmarks 2026Socialinsider
- 2026 Social Media Industry Benchmark ReportRival IQ by Quid
- The State of Social Media Engagement in 2026Buffer
- Instagram engagement rate benchmarks by tierHypeAuditor
- Instagram media insightsMeta for Developers
- Instagram ranking explainedInstagram
- Threads insightsMeta for Developers
- Meta deprecates impressions in favor of viewsSocial Media Today
- Fighting engagement bait on FacebookMeta Newsroom
- Content analytics for your LinkedIn PageLinkedIn Help
- Pinterest AnalyticsPinterest Help Center
- Video objectTikTok for Developers
- Videos resourceYouTube Data API, Google for Developers
- Understand your YouTube engagementYouTube Help
- Status entityMastodon documentation
- Channel statisticsTelegram API documentation
- Channels FAQTelegram
- Chat folders, archive and channel statsTelegram blog
- Message resourceDiscord Developer Documentation
- Video: Sounds can drive engagementTikTok For Business
- Video: YouTube Analytics in four stepsCreator Insider
- Video: Canva and Pinterest on audience engagementPinterest
Researched and written by Spreadcast. Last checked on October 28, 2026.