What Is Cost per Install?
Cost per install (CPI) is the price of one app download bought with advertising. As a metric it is simple: ad spend divided by the installs that spend produced. Adjust's glossary gives the plain example: $500 of mobile ads that bring 150 installs is a CPI of $3.33. If you are asking what is cost per install in a meeting, that division is the whole answer.
The term also names a pricing model. In CPI advertising, the advertiser pays the ad network a fixed price each time someone installs the app after seeing its ad, rather than paying for impressions or clicks. AppsFlyer's CPI glossary defines it this way, as a predetermined price agreed with the publisher, and separates it from eCPI, the effective cost per install you end up paying once the campaign has run. In practice most money today goes through networks that bill by impression or tap and optimize toward installs, so the CPI you report is almost always an effective one.
A quick note on the search term cpi in marketing. Outside apps, CPI can mean the consumer price index, and in some older ad glossaries it stands for cost per impression. On this page CPI always means cost per install, the app metric. When a report says CPI next to an iOS or Android figure, that is the meaning.
CPI matters because it is the first number in every paid app growth plan and the easiest one to misread. A low CPI is not good news on its own. A $0.15 install that never opens the app twice costs more per real user than a $3 install that subscribes. The rest of this page gives you the published benchmarks, explains why they disagree so much, and shows the one check that tells you whether your own CPI is affordable: what an install earns.
Cost per Install Benchmarks at a Glance
The figures people quote most, with who measured them, when and how. Read the last column before comparing two rows: a median across all apps and an average for one ad network are different numbers.
| Benchmark | Figure | Source, period and definition |
|---|---|---|
| Median eCPI, all apps, all platforms | $1.15 (first half of 2024); $1.27 (2023) | Adjust eCPI benchmarks, July 30, 2024. Median across apps Adjust measures. |
| Median eCPI, iOS vs Android | iOS $1.74, Android $0.56 (first half of 2024) | Adjust eCPI benchmarks |
| Median eCPI, North America | $2.12 (first half of 2024) | Adjust eCPI benchmarks. Highest region in the dataset. |
| Median CPI, shopping apps worldwide | $1.08 (first half of 2026); $1.06 (2025) | Adjust shopping app insights report 2026, as reported by PPC Land, August 27, 2026 |
| Median CPI, shopping apps, United States | $3.28, up 22% | Adjust shopping report via PPC Land. UK and Ireland highest at $3.85. |
| CPI, ecommerce apps worldwide | $0.98 in 2025, down from $1 | Adjust Mobile app trends 2026. Deal discovery apps rose from $1.44 to $2.26. |
| Apple Ads average cost per acquisition | $3.76 (2025) | SplitMetrics Apple Ads benchmarks, search results ads, published September 14, 2026 |
| Apple Ads most expensive categories | Sports $19.74, Finance $13.28, Medical $8.90 | SplitMetrics, 2025 data |
| Average CPI, casual games | iOS $1.41, Android $0.14 | Liftoff 2025 Casual Gaming Apps Report, Singular data, February 2024 to February 2025 |
| Average CPI, casino games on iOS | $21.03 | Liftoff 2025 Casual Gaming Apps Report |
| Average CPI by platform | iOS $3.60, Android $1.20 | AppsFlyer CPI glossary, undated averages on a page last updated April 2024 |
| Average CPI by region | North America $5.30, LATAM $0.30 | AppsFlyer CPI glossary |
All pages were opened on October 28, 2026. Medians and averages are reported as each source states them; we did not convert one into the other.
How We Researched This
We opened every source on October 28, 2026 and quote only what those pages say. Adjust's numbers come from its public eCPI benchmarks article, its cost per install glossary and the public preview of Mobile app trends 2026. The full Adjust reports sit behind a download form, so for the country figures of the shopping app insights report 2026 we rely on PPC Land's detailed write up of it, and we say so wherever we use them. AppsFlyer figures come from its CPI glossary and its Top 5 Data Trends of 2025 report. Liftoff figures come from the public web version of its 2025 Casual Gaming Apps Report, the newest Liftoff report we could find with CPI numbers on an open page.
Business of Apps publishes a widely quoted CPI page, but its site blocked our checker behind a bot test on the day, and we do not get past those. Its headline figures appear inside Adjust's glossary, which cites Business of Apps by name, so we quote them from there and label them as Business of Apps figures quoted by Adjust. Their age is not stated; Adjust's page points readers to its 2023 trends report next to them, so treat them as older numbers.
Apple Ads pricing comes from Apple's own pages: Apple Ads Basic, the comparison of Basic and Advanced and the help article on setting bids. Apple does not publish average prices, so Apple Ads cost benchmarks come from SplitMetrics, an Apple Ads agency and software vendor that reports on its own campaign data. Google and Meta bidding rules come from their help centers. Revenue per install comes from RevenueCat's State of Subscription Apps 2026.
Anything we calculated is labeled as derived and shows the arithmetic. We did not use the many CPI tables that circulate on agency blogs without a traceable source, which is why some round numbers you may have seen elsewhere are missing here. If a figure is old, we print its date next to it rather than drop it, because an honest 2024 median is more useful than an untraceable 2026 one.
Cost per Install Formula
The cost per install formula is one division: CPI = ad spend ÷ installs attributed to that spend. Spend $1,000 on a campaign that brings 400 installs and your CPI is $2.50. Every ad platform shows this number in its dashboard, and so does every mobile measurement partner (MMP) such as AppsFlyer or Adjust.
Effective cost per install, eCPI, is where definitions split. Adjust's eCPI article gives two versions. The first divides the CPI by a K factor, a virality coefficient for the extra users each new user brings: with a $5 CPI and one extra user for every ten new ones, K is 1.1 and eCPI is $5 ÷ 1.1 = $4.55. The second, simpler version divides total ad spend by total installs, paid and organic together. Both say the same thing: some of the installs that arrive while you advertise are a side effect of the ads, and counting them makes paid acquisition look cheaper.
That second version is also called blended CPI, and it is the number to be careful with. If you spend $1,000 and get 400 paid installs plus 600 organic ones, your paid CPI is $2.50 and your blended CPI is $1.00. Neither is wrong. Paid CPI tells you whether to put the next dollar into that channel. Blended CPI tells you what growth costs the business overall. Write which one you mean every time you report it.
Three smaller formulas sit next to CPI and are worth computing at the same time. Cost per tap (CPT) is spend ÷ taps, the unit Apple Ads Advanced bills in. Conversion rate is installs ÷ taps. Put them together and CPI = CPT ÷ conversion rate: a $2.00 tap that converts 50% of the time is a $4.00 install. Cost per paying user is CPI ÷ install to paid conversion: a $4.00 install that converts to a subscriber 2% of the time costs $200 per subscriber. That last number, not CPI, is what you compare with lifetime value.
CPI, eCPI, CPT, CPA and CPM: Which Is Which
The pricing and reporting terms that show up next to cost per install, with the formula behind each one.
| Term | What you pay for or measure | Formula |
|---|---|---|
| CPI, cost per install | One app install, as a price or as a result | Spend ÷ installs |
| eCPI, effective cost per install | What installs really cost after the campaign, sometimes with organic installs counted | Spend ÷ installs, or CPI ÷ K factor |
| CPT, cost per tap | One tap on an Apple Ads ad (Advanced) | Spend ÷ taps |
| CPA, cost per acquisition or action | One install (SplitMetrics uses CPA for the Apple Ads download) or one event after install, such as a sign up or purchase | Spend ÷ acquisitions or actions |
| CPM, cost per mille | One thousand impressions; how Meta and many networks bill | Spend ÷ impressions × 1,000 |
| IPM, installs per mille | Installs for every thousand impressions; a creative quality signal | Installs ÷ impressions × 1,000 |
| Cost per paying user | One subscriber or buyer from paid installs | CPI ÷ install to paid conversion rate |
The CPI and eCPI definitions follow AppsFlyer and Adjust. CPM links to CPI through IPM: CPI = CPM ÷ IPM.
Average Cost per Install on iOS vs Android and by Region
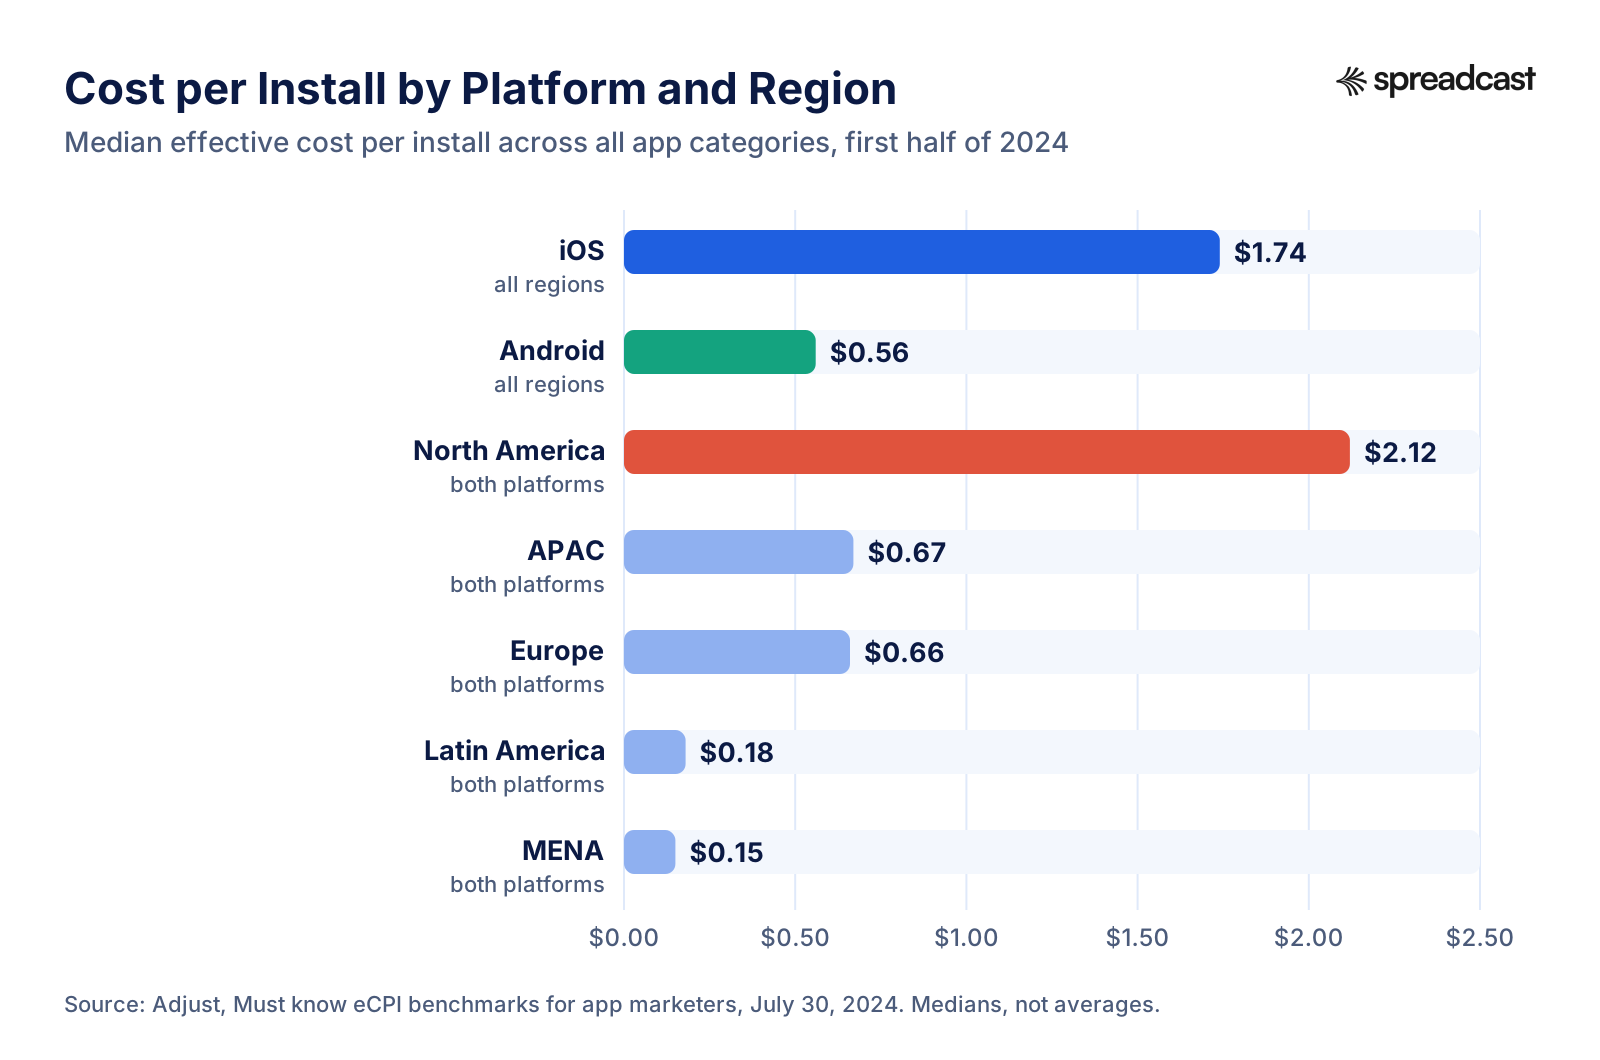
Adjust's medians across all the apps it measures. iOS installs cost about three times Android installs, and North America costs more than every other region by a wide margin.
Average Cost per Install: iOS vs Android
Every source agrees on the direction: an iOS install costs more than an Android install. They disagree on the size. Adjust's eCPI benchmarks put the 2023 median at $1.86 on iOS and $0.69 on Android, with the overall median at $1.27. In the first half of 2024 all three fell, to $1.74 on iOS, $0.56 on Android and $1.15 overall. That is an iOS premium of about 3.1 times (derived: $1.74 ÷ $0.56).
AppsFlyer's glossary quotes higher averages, $3.60 on iOS and $1.20 on Android, exactly three times apart, and explains the gap the same way most sources do: iOS has a larger share of users in high income regions such as North America, Japan and Europe, while Android dominates in LATAM, India and Southeast Asia. Business of Apps figures quoted on Adjust's glossary are almost identical: iOS $3.60 and Android $1.22 globally, and for games $4.30 on iOS against $1.15 on Android.
Games show the widest platform gap. Liftoff's 2025 Casual Gaming Apps Report, built on Singular data from February 2024 to February 2025, found an average casual game CPI of $1.41 on iOS and $0.14 on Android, ten times apart. Liftoff's summary of the report adds that simulation, action and racing games see roughly ten times higher CPIs on iOS.
The reason iOS still gets most of the budget is that iOS users pay more. RevenueCat's State of Subscription Apps 2026 reports a median day 60 revenue per install of $0.42 on the App Store, and in North America $0.65 on iOS against $0.26 on Android. Liftoff found the same in games: average day 30 return on ad spend for casual games was 47% on iOS and 15% on Android. A higher CPI that comes with higher revenue per install can be the cheaper buy.
iOS spend is also growing faster. AppsFlyer's Top 5 Data Trends report says global app user acquisition spend reached $78 billion in 2025, up 13%, and that the growth came entirely from iOS, up 35%, while Android was flat at minus 1%. Paid iOS installs rose 31% in the US, 64% in the UK and 80% in Canada, while Android paid installs grew 8% in the US, 1% in the UK and fell 9% in Australia. More money chasing iOS users is one reason iOS CPIs rarely fall for long.
One structural reason iOS installs are harder to buy cheaply is measurement. Apple's App Tracking Transparency framework lets each user choose whether an app may track their activity across other companies' apps and websites for advertising. Fewer trackable users means less precise targeting and attribution on iOS, which is one reason so many iPhone advertisers lean on Apple Ads, where the ad and the install both happen inside the App Store.
Cost per Install by Country
Country is the biggest single driver of CPI, bigger than platform or category. The most recent public country figures come from Adjust's shopping app insights report, covering January 2024 to June 2026 and published August 27, 2026. As PPC Land reported, the global median CPI for shopping apps was $1.08 in the first half of 2026, almost flat against $1.06 in 2025, while the spread between countries widened.
In that dataset the UK and Ireland were the most expensive market at $3.85 per install, up 80%. The United States followed at $3.28, up 22%, then DACH (Germany, Austria and Switzerland) at $3.13, down 1%. France cost $1.73, up 24%. At the cheap end, Türkiye cost $0.37, down 5%, and India $0.10, down 57%, the largest fall of any country. By region, North America was $3.12, up 14%, and Europe $2.17, up 4%.
Those are shopping apps only, so read them as a picture of the spread, not as a price for your app. Adjust's all category data shows the same order of regions. In the first half of 2024 the median eCPI was $2.12 in North America, $0.67 in APAC, $0.66 in Europe, $0.18 in LATAM and $0.15 in MENA, according to its eCPI benchmarks. North America costs roughly 12 times LATAM on that measure (derived: $2.12 ÷ $0.18).
Older averages show an even bigger gap. AppsFlyer's glossary cites an average CPI of $5.30 in North America against $0.30 in LATAM. The Business of Apps figures quoted by Adjust give North America $5.28, EMEA $1.03, APAC $0.93 and Latin America $0.34. Those are averages rather than medians, and averages are pulled up by expensive categories such as casino and finance, which is why they sit above Adjust's medians.
Cheap countries are cheap for a reason. Revenue per install falls with them. RevenueCat's 2026 report puts median day 60 revenue per install at $0.55 in North America, $0.33 in Europe and $0.11 in India and Southeast Asia. A $0.10 install in India that earns $0.11 by day 60 and a $3.28 install in the US that earns $0.55 are both real benchmarks; only one of them may suit your app.
Cost per Install by Country and Region
Every country and region figure we could trace to its publisher. The period and app type are in the last column; do not compare a shopping app median with an all app average without reading it.
| Country or region | CPI | Source, period and app type |
|---|---|---|
| United Kingdom and Ireland | $3.85 (up 80%) | Adjust shopping report via PPC Land; shopping apps, first half of 2026, median |
| United States | $3.28 (up 22%) | Same report; shopping apps, first half of 2026 |
| DACH (Germany, Austria, Switzerland) | $3.13 (down 1%) | Same report; shopping apps, first half of 2026 |
| France | $1.73 (up 24%) | Same report; shopping apps, first half of 2026 |
| Türkiye | $0.37 (down 5%) | Same report; shopping apps, first half of 2026 |
| India | $0.10 (down 57%) | Same report; shopping apps, first half of 2026 |
| North America | $3.12 shopping; $2.12 all apps | Shopping via PPC Land, 2026; all apps from Adjust eCPI, first half of 2024, medians |
| Europe | $2.17 shopping; $0.66 all apps | Same two sources and periods |
| APAC | $0.67 all apps | Adjust eCPI, first half of 2024, median |
| Latin America | $0.18 all apps; $0.30 average | Adjust eCPI median; AppsFlyer glossary average |
| MENA | $0.15 all apps | Same Adjust source and period, median |
| North America, older average | $5.28 to $5.30 | Business of Apps via Adjust glossary; AppsFlyer glossary |
Percent changes in the shopping rows are year over year, as reported by PPC Land from the Adjust report.
Cost per Install in the USA
The United States is the market most app founders price first, and it is close to the top of every table. The newest public figure is the $3.28 median for shopping apps in the first half of 2026, up 22% on the year, from the Adjust shopping report as covered by PPC Land. For iPhone apps in general, SplitMetrics' Apple Ads data names North America (the US, Canada and Puerto Rico) as the highest cost market for both cost per tap and cost per acquisition, driven by sharp seasonal peaks.
Category changes the US number a lot. Adjust's eCPI benchmarks for North America in the first half of 2024 put games at $2.14, social apps at $2.15, lifestyle apps at $1.43, health and fitness at $1.19 and utilities at $0.64. A fitness app advertising in North America should therefore expect to pay well above the worldwide median of $0.72 for its category, and a game about twice the worldwide $1.07.
If you advertise on Apple Ads, the closest public benchmark is SplitMetrics' overall average of $3.76 per download in 2025, a figure across all its markets, with North America above it. Apple Ads search users have high intent and advertisers bid for them accordingly. SplitMetrics also reports that 66.2% of taps on search results ads became downloads in 2025, which is part of why advertisers accept the price.
What a US install earns sets the ceiling on what you can pay. RevenueCat's day 60 median revenue per install for North America is $0.55, and $0.65 on iOS, with the top quartile above $1.39. Derived: at the $3.28 shopping median, a US install would need about six times the median North American revenue per install to pay back by day 60 ($3.28 ÷ $0.55 = 6.0). That is not unusual for paid acquisition, where payback often takes months, but it tells you that buying US installs is a bet on retention, not on first week revenue.
Cost per Install by App Category
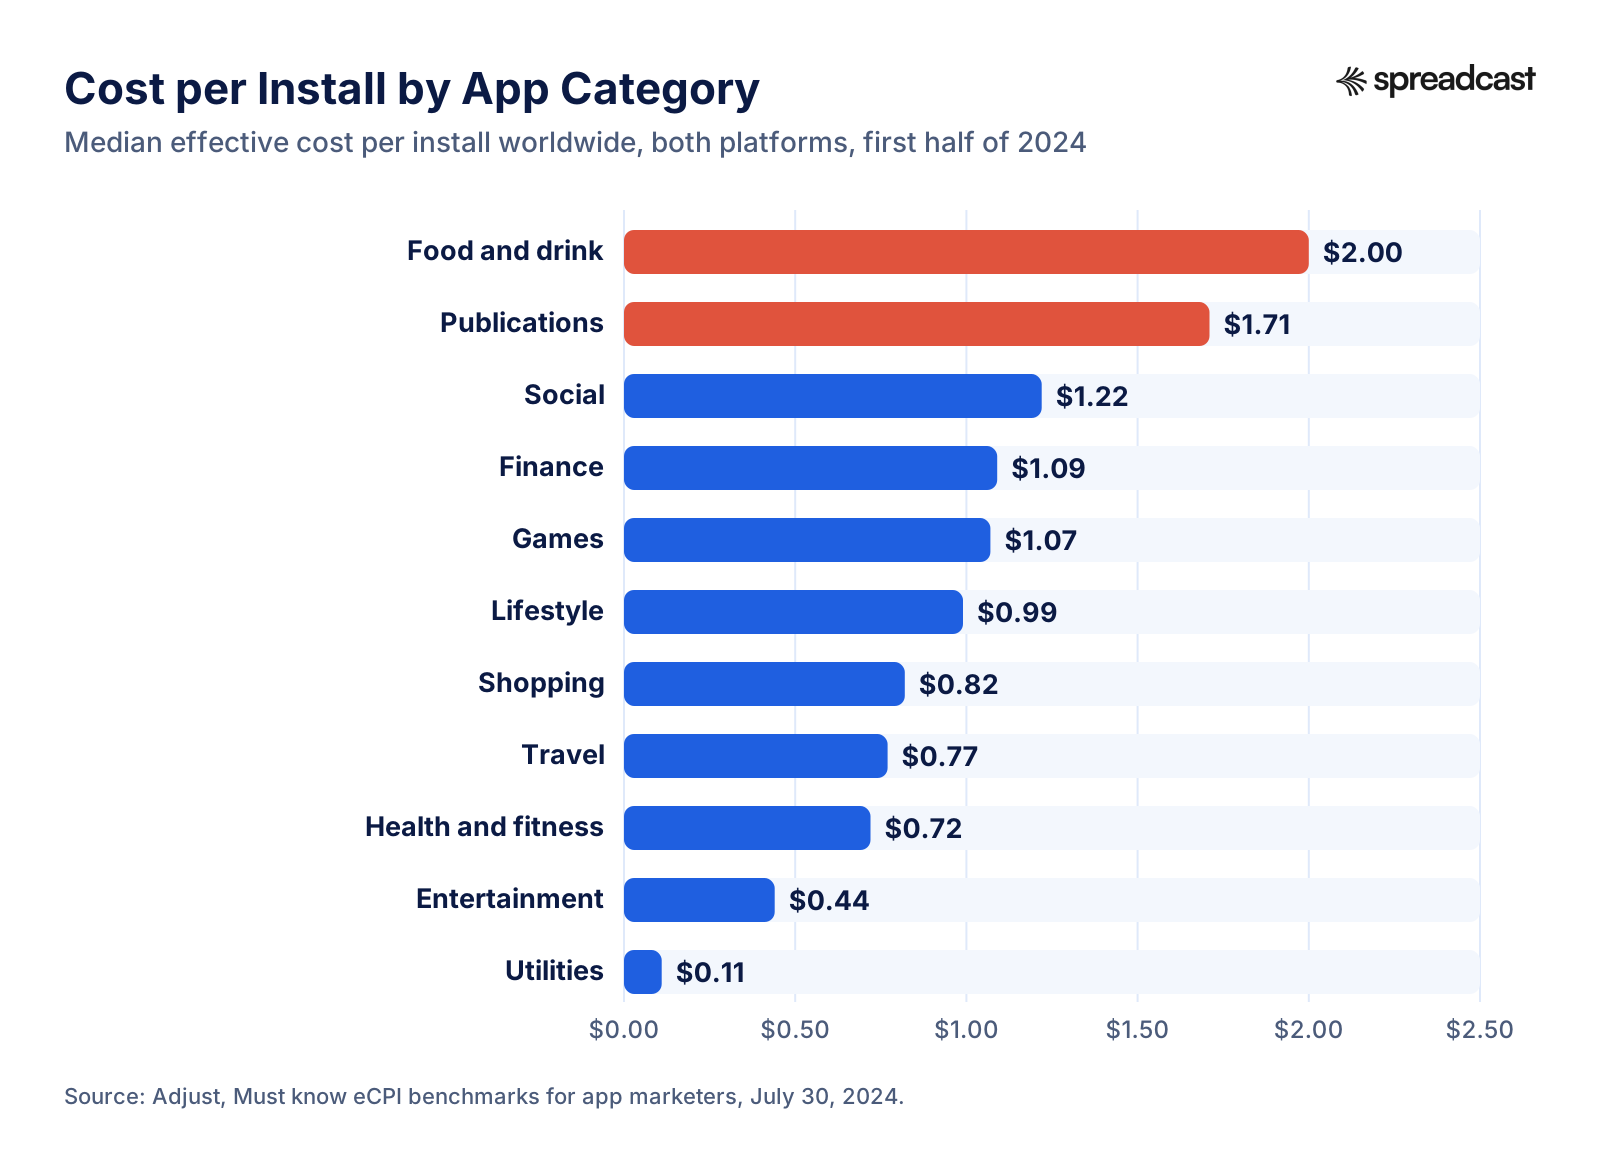
Adjust's worldwide medians by vertical. Food and drink and publications apps cost the most to acquire; utilities cost the least.
Cost per Install by Industry and App Category
Category is the second biggest driver after country. Adjust's eCPI benchmarks list worldwide medians for the first half of 2024, with 2023 in brackets: food and drink $2.00 ($2.69), publications $1.71 ($2.15), social $1.22 ($1.53), finance $1.09 ($1.21), games $1.07 ($1.15), lifestyle $0.99 ($1.23), shopping $0.82 ($0.99), travel $0.77 ($0.97), health and fitness $0.72 ($0.74), entertainment $0.44 ($0.46) and utilities $0.11 ($0.21). Every category fell between the two periods.
The 2026 data that is public points in two directions. Adjust's Mobile app trends 2026 preview says CPI for ecommerce apps declined to $0.98 from $1 in 2025, while deal discovery apps rose from $1.44 to $2.26. The shopping report covered by PPC Land puts deal discovery at $2.69 in the first half of 2026, up 30%, the highest of the three shopping subverticals. Costs are not moving together; they move by subvertical and by country.
Apple Ads shows a much steeper category curve because finance, sports and medical advertisers compete for a small set of high value searches. SplitMetrics' 2026 benchmarks put the 2025 average cost per acquisition at $19.74 for Sports, $13.28 for Finance and $8.90 for Medical, against $3.76 overall. Cost per tap followed the same order: Sports $14.41, Finance $6.06, Medical $4.45, with an average of $2.25 across the top 15 categories. SplitMetrics links the Sports peak to seasonal events such as the Super Bowl and the January fitness rush.
Finance stands out in every source for the same reason: a funded account or a first trade is worth a lot, so advertisers bid high. Utilities stand out at the other end because almost anyone will install a flashlight or a scanner, and few of those users ever pay. When you read a category benchmark, ask what an install in that category is worth to the companies setting the price. That is what you are bidding against.
Cost per Install by Category and Region
Adjust's medians for the first half of 2024, worldwide and in the three regions it breaks out by category. Blank cells mean the source did not report that pair.
| Category | Worldwide | North America | Europe | APAC |
|---|---|---|---|---|
| Games | $1.07 | $2.14 | $0.59 | $0.64 |
| Social | $1.22 | $2.15 | $1.72 | $0.51 |
| Lifestyle | $0.99 | $1.43 | $0.84 | $0.44 |
| Health and fitness | $0.72 | $1.19 | $0.82 | $0.45 |
| Travel | $0.77 | $2.13 | $0.72 | |
| Utilities | $0.11 | $0.64 | $0.19 | $0.04 |
| Finance | $1.09 | |||
| Shopping | $0.82 | |||
| Food and drink | $2.00 |
Source: Adjust eCPI benchmarks, July 30, 2024. Adjust also reports MENA games at $0.13, shopping at $0.47 and social at $0.64, and LATAM games at $0.17.
Mobile Game CPI Benchmarks
Games are the largest buyers of installs and have the most published CPI data, much of it from Liftoff. Its 2025 Casual Gaming Apps Report is built on Singular data from February 2024 to February 2025 covering 1.1 trillion impressions, 2.4 billion installs and $11.9 billion in spend. Its headline: CPI stays higher on iOS for all game genres, casual games averaged $1.41 on iOS and $0.14 on Android, and casino games on iOS reached $21.03. RPG, strategy and tabletop games also cost more on both platforms, which Liftoff puts down to niche audiences and fewer ads running.
The same report shows why studios keep paying iOS prices. Average day 30 return on ad spend for casual games was 47% on iOS and 15% on Android; sports games reached 80% on iOS, kids games 68% and strategy 60%. In other words, an iOS casual game recovered almost half its install cost in a month, while Android recovered less than a sixth.
Genre and country interact. AppsFlyer's glossary gives examples from Japan: puzzle games at $1.77 on Android and $3.69 on iOS, action games at $2.01 and $3.96, educational games at $1.09 and $3.04. It also notes that hypercasual games usually cost $1 or less per install while midcore and hardcore games can cost up to five times that. Adjust's regional figures put games at $2.14 in North America, $0.64 in APAC, $0.59 in Europe, $0.17 in LATAM and $0.13 in MENA.
Gaming budgets are no longer growing fast. AppsFlyer's 2025 data shows gaming user acquisition spend up only 3% to $25 billion, against 18% growth to $53 billion for non gaming apps. For indie game makers that is mildly good news; the auction is not getting more crowded as quickly as it did. Our mobile game marketing guide covers what to do before you buy a single install, and the mobile game market statistics page sizes the market by genre.
How Apple Search Ads Pricing Works in Practice
A workshop recorded at Business of Apps London on structuring Apple Ads campaigns, with a section on auction pricing and how competitors move your costs.

Apple Search Ads Cost per Install
Apple Ads (formerly Apple Search Ads) is the channel most iPhone founders try first, and it is the only major channel that lets a small advertiser pay strictly per install. Apple sells it in two versions. Apple Ads Basic shows your app at the top of App Store search results and charges only for installs, at a price you set: Apple suggests a maximum cost per install, or you choose your own, and it tries to maximize installs for your monthly budget. Eligible new accounts can try it with a 100 USD credit. Apple's comparison page caps Basic at $10,000 a month per app and 50 apps, with no keyword data.
Apple Ads Advanced is the full product. It runs on the Today tab, the Search tab, search results and other apps' product pages, and it uses cost per tap pricing: you pay only when someone taps your ad, up to a maximum you choose. Apple's help page on bids says your max CPT bid is a ceiling, that the price you actually pay can be lower, and that it is set by a dynamic pricing mechanism that weighs relevance, your bid and other advertisers' bids. Advanced campaigns can also carry a CPA cap, and Maximize Conversions campaigns bid automatically without a max CPT.
Because Advanced bills taps, your Apple Ads cost per install is your cost per tap divided by your tap to install conversion rate. SplitMetrics' 2026 benchmarks, built on its own campaign data for 2025, put the average tap through rate at 9.7%, the conversion rate at 66.2%, the average CPT across the top 15 categories at $2.25 and the overall average cost per acquisition at $3.76. The cheapest window was April; the combined peak of CPT and CPA came in September.
Two things lower Apple Ads CPI more than any bid trick. The first is the conversion rate of your product page, because a page that turns 70% of taps into installs makes every tap cheaper per install than one that converts 50%. The second is relevance: Apple's auction rewards ads that match the search. Apple's custom product pages let you publish up to 70 extra versions of your product page with different screenshots, promotional text and previews, and link each to the keywords it fits. Apple's own case study for State of Survival reports results of 33% on conversion rate and 14% on cost per install for its RPG focused page against the default. Our App Store conversion rate page covers the store side in detail.
Apple Ads Benchmarks for 2025
SplitMetrics' averages for Apple Ads search results campaigns, the most cited public Apple Ads cost data.
| Metric | 2025 figure | Note |
|---|---|---|
| Average cost per acquisition (download) | $3.76 | All categories in the SplitMetrics dataset |
| Highest CPA categories | Sports $19.74, Finance $13.28, Medical $8.90 | Sports peaks around the Super Bowl and in January |
| Average cost per tap | $2.25 | Across the top 15 categories |
| Highest CPT categories | Sports $14.41, Finance $6.06, Medical $4.45 | |
| Average tap through rate | 9.7% | Reference apps highest at 15.2% |
| Average conversion rate (tap to install) | 66.2% | Sports highest at 73.0% |
| Most expensive region | North America | US, Canada and Puerto Rico; LATAM and AMEI cheapest and most stable |
| Cheapest and dearest months | April cheapest; September peak | CPT about $2.00 and CPA $3.20 at the September peak |
Source: SplitMetrics, Apple Ads cost benchmarks for 2026, published September 14, 2026, based on its 2025 campaign data. The article's text cites Sports CPA as both $19.74 and $19.71; we use the first.
How Meta and Google Price App Installs
Meta and Google do not sell installs at a fixed price. They run auctions and let you steer the average. On Meta you pick one of its bid strategies for the campaign. Highest volume spends your budget for as many results, here installs, as possible. Cost per result goal tells the system the average cost per install you want and maximizes installs near it, with Meta's note that adherence is not guaranteed. Bid cap sets the maximum bid in each auction. Meta recommends 50 to 100 or more conversions a week for the best performance, which matters for a small budget: at a $2 install that is at least $100 a week before the system has enough data (derived).
Meta's own pricing page recommends starting with a budget of at least $5 and a duration of more than six days so the delivery system can find the right people. That is the floor for a test, not a guide to what an install will cost. Your CPI on Meta is the outcome of CPM and creative quality: CPI = CPM ÷ installs per thousand impressions, so a better ad lowers CPI without any change in the auction.
Google App campaigns offer target cost per install (tCPI) bidding for install campaigns, alongside target cost per action and Maximize conversions, according to Google's page on App campaign bid strategies. Google's App campaign best practices set a rule worth knowing before you plan a budget: for tCPI campaigns the daily budget should be at least 50 times the bid. Derived: a $2 tCPI needs $100 a day, about $3,000 a month; a $3.76 target needs $188 a day, about $5,640 a month. For in app action targets (tCPA) Google asks for at least 10 times the bid.
Those rules explain why small paid tests so often fail. A $300 budget spread across Meta and Google never gives either system enough installs to learn, so CPI stays high and the test looks like proof that ads do not work. If you test paid installs, pick one channel, size the budget to its minimum learning volume, and decide in advance the CPI at which you stop.
Running iOS App Campaigns on Google Ads
Google Ads' own short guide to feeding its App campaign models the privacy safe signals they need to bid well on iOS.

Why Cost per Install Benchmarks Disagree
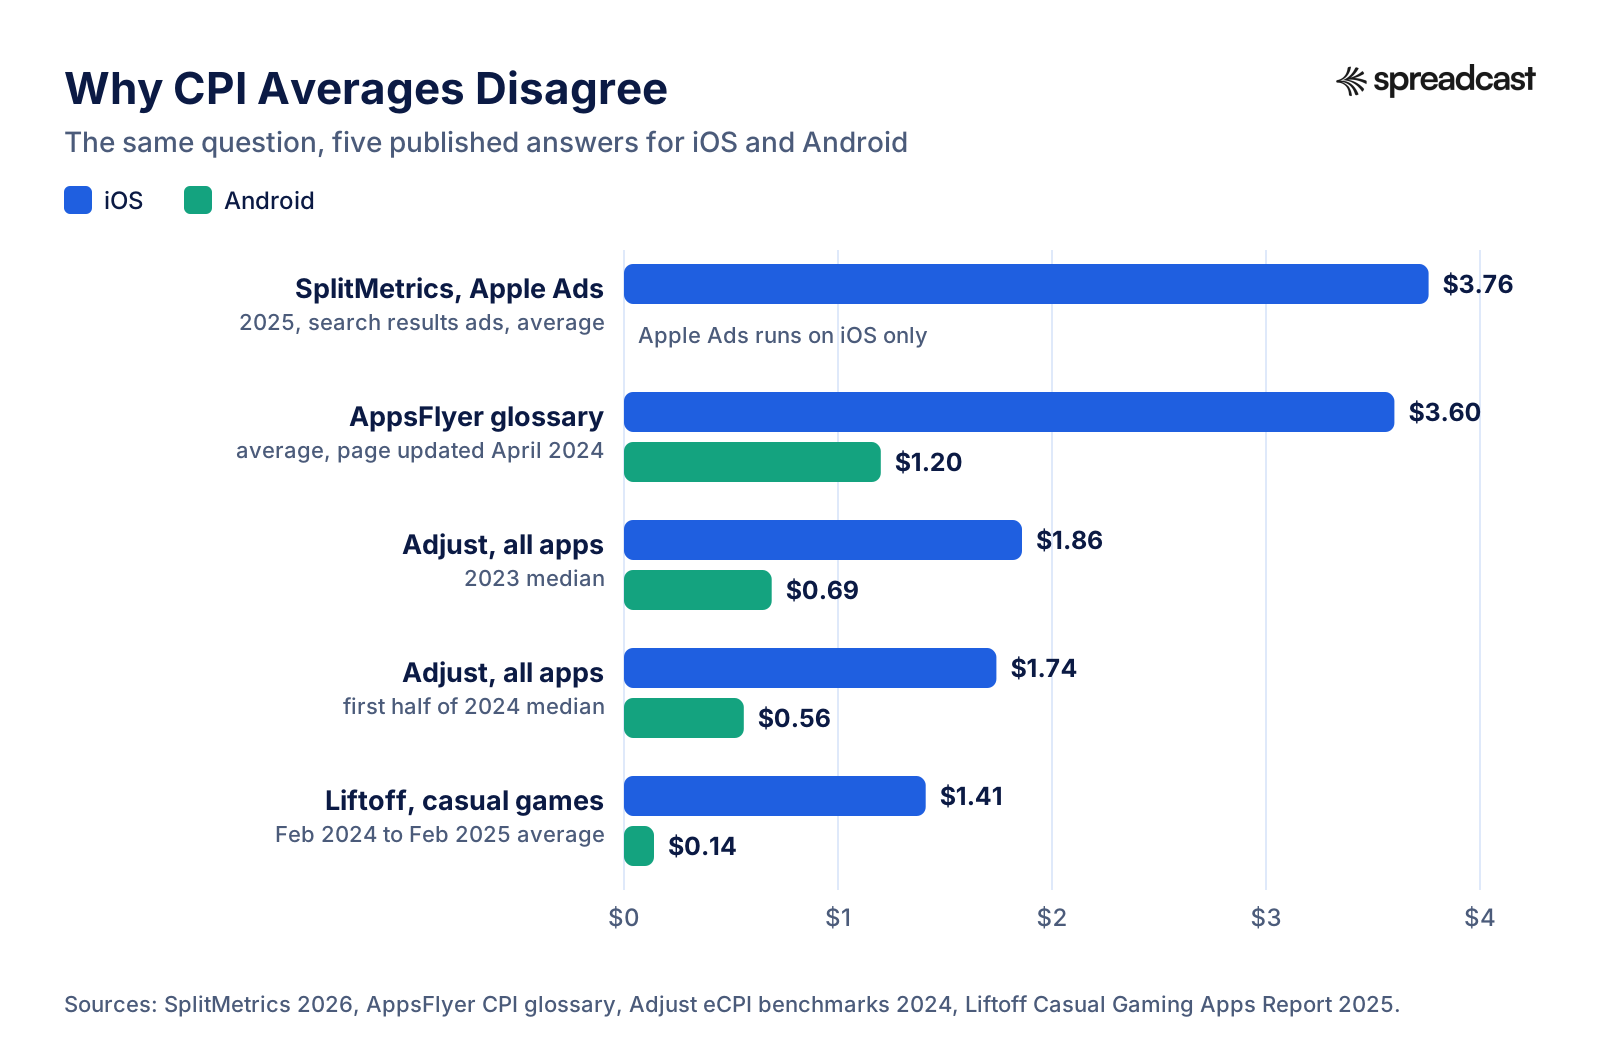
Five published answers to the same question. They are all correct for what they measure; they just measure different things.
Why CPI Benchmarks Disagree
Search for the average cost per install and you will find figures from $0.14 to $5.30 for the same platform. Most of that range is not error. It comes from five differences in how the numbers were made, and once you see them you can pick the right benchmark for your app.
Median or average. Adjust reports medians across apps; AppsFlyer's glossary, Liftoff and SplitMetrics report averages. A few expensive categories such as casino, finance and sports pull an average far above the middle app. Adjust's iOS median of $1.74 and AppsFlyer's iOS average of $3.60 can both be true at the same time.
Which apps are in the sample. Liftoff's casual game figures cover games; Adjust's shopping report covers shopping apps; SplitMetrics covers apps that pay an agency to run Apple Ads, which skews toward finance and other high value categories. A benchmark only fits an app that resembles the sample.
Which channel. An Apple Ads install costs more than an average install because search intent is high and the conversion rate is two thirds of taps. Rewarded video inside other games is cheap because the viewer is already playing. Blending them gives a number that matches neither.
Paid only or blended. If a source counts organic installs in the denominator, as one of Adjust's eCPI definitions does, its CPI will be lower than a paid only figure for the same apps. When a benchmark says eCPI, check which version it means.
When. CPI moves with the season and the year. SplitMetrics finds April cheapest and September most expensive on Apple Ads; Adjust's medians fell between 2023 and 2024; its shopping data shows the US up 22% and India down 57% in one year. A 2023 figure is still useful for the shape of the market, but not for your budget.
The practical rule: pick the benchmark that matches your platform, your main country, your category and your channel, in that order, and then trust your own first $500 of spend over any table.
What Is a Good Cost per Install?
A good cost per install is one that your installs pay back within a time your cash can wait. That is the only definition that holds across countries and categories. A $6 install for a finance app whose customers are worth $200 is a bargain; a $0.50 install for a free utility that earns nothing is a loss.
So the benchmark to compare your CPI with is not anyone's CPI. It is your own revenue per install. RevenueCat's State of Subscription Apps 2026, covering over 115,000 apps, puts the median revenue per install at $0.23 by day 14 and $0.34 by day 60 across all categories. Health and fitness apps reach $0.48 by day 14 and $0.66 by day 60; games reach $0.08 and $0.14. Apps whose main plan is yearly earn $0.46 per install by day 60; apps with a hard paywall earn $3.09 against $0.38 for freemium apps.
Set those beside the CPI benchmarks and the picture is plain. Derived: at the SplitMetrics Apple Ads average of $3.76, the median install has returned about 9% of its cost by day 60 ($0.34 ÷ $3.76). A North American iOS install, at RevenueCat's $0.65, has returned about 17%. Even at Adjust's much lower North America median of $2.12, it is about 31%. Paid installs can still work, but only for apps whose revenue per install is well above the median, or whose users keep paying for years.
This matches what our LTV to CAC ratio page found from the same two datasets: the median paid install earns roughly a tenth of its cost in its first two months, and a small app usually has to prove conversion and retention well above the median before paid installs reach a 3:1 ratio. The startup marketing budget page uses the same $3.76 and $0.34 to show why most early app budgets belong in free and cheap channels first.
A rough rule we use for a first test: your target CPI should be no more than your realized revenue per install at the horizon you can afford to wait. If your cash allows six months of payback and your own cohorts show $1.20 per install by day 180, a CPI under $1.20 is good, one under $0.40 lets you aim for 3:1, and one above $1.20 loses money until something else changes.
How to Check a CPI Against LTV
Five steps, with a worked example for a fictional iPhone habit tracker. Replace the inputs with your own numbers; the arithmetic stays the same.
- Step 1
1. Find Your Revenue per Install at Day 30, 60 and 180
Open the Cohorts section of App Store Connect Analytics and read Proceeds per Download, the average proceeds generated within a number of days of download, net of Apple's commission. Example: $0.40 at day 30, $0.62 at day 60, $1.05 at day 180.
- Step 2
2. Choose the Payback Horizon You Can Afford
How long can your cash wait for an install to pay for itself? A founder with six months of runway cannot fund a 12 month payback. Example: 180 days.
- Step 3
3. Set a Break Even CPI and a Target CPI
Break even CPI is the revenue per install at your horizon: $1.05. A target that leaves room for the rest of the business is a third of that, in the spirit of the 3:1 rule: $0.35. Write both down before you spend anything.
- Step 4
4. Compare With the Benchmark for Your Market
A North American health and fitness install had a median of $1.19 on Adjust's data, and SplitMetrics' overall Apple Ads average is $3.76. Against a $1.05 break even CPI, North American paid installs are a loss for this app at the median. Cheaper markets or a better product page are the levers, not a bigger budget.
- Step 5
5. Test One Channel With a Stop Rule
Give one channel a fixed budget large enough for its learning period, and stop if CPI stays above your break even CPI once that period is over. Then recheck revenue per install for the paid cohort alone, because paid users often behave differently from organic ones.
Break Even CPI by Revenue per Install
What you can pay per install to break even by day 60, and to reach a 3:1 return, at the median revenue per install for each group in RevenueCat's 2026 report. Derived from its medians.
| App group | Median revenue per install, day 60 | Break even CPI by day 60 | CPI for 3:1 by day 60 |
|---|---|---|---|
| All subscription apps | $0.34 | $0.34 | $0.11 |
| Health and fitness | $0.66 | $0.66 | $0.22 |
| Games | $0.14 | $0.14 | $0.05 |
| Apps selling mainly yearly plans | $0.46 | $0.46 | $0.15 |
| Apps with a hard paywall | $3.09 | $3.09 | $1.03 |
| North America, iOS | $0.65 | $0.65 | $0.22 |
| India and Southeast Asia | $0.11 | $0.11 | $0.04 |
Revenue per install medians from RevenueCat State of Subscription Apps 2026. Day 60 is a strict horizon; most apps keep earning after it, so use your own longer cohorts once you have them.
App User Acquisition Cost vs Cost per Install
App user acquisition cost is a wider number than CPI. CPI prices an install; acquisition cost prices a customer. The step between them is conversion. If 2% of installs become paying users, the cost of a paying user is 50 times the CPI. That is the number to put in your LTV to CAC calculation, not the CPI.
RevenueCat's 2026 report puts the median download to paid conversion by day 35 at 2.0% worldwide and 2.6% in North America, with the top quartile in North America above 5.6%. Derived: at the Apple Ads average of $3.76, a paying user costs about $188 at the global median ($3.76 ÷ 0.02) and about $145 at the North American median ($3.76 ÷ 0.026). At Adjust's $2.12 North America median eCPI, the same North American paying user costs about $82.
App acquisition costs also include more than media. A fair cost line adds the creative production for ads, the mobile measurement partner, the hours someone spends running campaigns, and any agency fee. For a small team these can match the media spend in the first months. If you only count media, your app acquisition cost looks lower than it is, and the gap shows up later as missing cash.
The good news for small apps is that conversion is the cheapest lever. Every point of product page conversion or install to paid conversion lowers the cost of a customer from every channel at once, paid and organic. Our guides to App Store optimization, App Store screenshot examples and getting App Store reviews cover the levers that move it, and app retention benchmarks shows what happens after the install.
Ways to Drive Installs and Lower CPI
AppsFlyer's short overview of the levers it sees lowering CPI across its clients, from App Store optimization to owned web and social traffic.

How to Lower Your Cost per Install
The levers that move CPI, roughly in the order a small app should pull them. None needs a bigger budget.
Fix the Product Page First
Your product page conversion rate divides every CPT into a CPI. Screenshots, the first caption lines, the icon and ratings all count. Start with App Store conversion rate benchmarks to see where you stand.
Match the Page to the Ad
Use custom product pages so a keyword or ad lands on screenshots about that exact feature. Apple allows up to 70 extra versions per app.
Bid on Your Own Brand and Exact Terms
Brand and exact match keywords usually convert far better than broad discovery terms. Start narrow on Apple Ads Advanced and widen only when a keyword earns its place.
Test Creatives, Not Only Bids
On Meta and Google, CPI is CPM divided by installs per thousand impressions. A creative that doubles IPM halves CPI. Our ad creative generator page lists the sizes each network needs.
Buy Cheaper Markets on Purpose
Adjust's medians put Europe at about a third of North America. If your app works in English and your pricing fits, a second market can halve blended CPI.
Time Your Spend
SplitMetrics finds April the cheapest month on Apple Ads and September the most expensive. Holiday seasons raise costs for most categories.
Grow Organic Installs Alongside Paid
Organic installs lower blended CPI and raise the ranking signals that make paid installs convert. Posts on social media with tracked campaign links show which networks bring downloads.
Use Moments Apple Already Promotes
In app events and a chance at getting featured bring installs you do not bid for, and a strong app preview video lifts conversion for paid and free traffic alike.
Organic Installs: The Cost per Install You Do Not Pay
Every benchmark on this page is about paid installs. For most small apps, the bigger lever is the installs that cost nothing per unit: App Store search, word of mouth, a launch, and social posts that send people to the product page. They still cost time, but not $3.76 a download.
The trouble with organic social is not that it fails to work; it is that it stops. A founder posts for three weeks, a release ships, the account goes quiet. What brings installs is steady posting with a link people can tap, and a way to see which network sent them. App Store Connect campaign links do the measuring: when someone taps one, Analytics records impressions, product page views, downloads, sales and subscriptions against that campaign token. Make one per network and you have a cost per install for organic posts that you can actually calculate: what you spent on making posts divided by the downloads each campaign shows.
If you have no designer and no time to post every day, this is the part Spreadcast was built for. You paste your App Store link at /start and it builds a brand kit from the listing: icon, colors and your real screenshots in an iPhone frame. When a new version goes live or the app reaches a ratings milestone, it designs the post, writes a caption for each network and publishes it, on autopilot or after one tap of approval. The product page visits you would otherwise buy at several dollars an install arrive from your own feed.
Organic posts work best next to a few other free channels. How to promote an app for free ranks fourteen of them by effort and results, how to get app downloads lists every source of installs with what each costs, and a launch on Product Hunt can bring a burst of installs at no media cost.
Cost per Install Budget Examples
Benchmarks become useful when you turn them into a monthly plan. Here is what three common budgets buy at three benchmark prices, using SplitMetrics' Apple Ads average of $3.76, Adjust's North America median of $2.12 and its Android median of $0.56. All figures are derived and rounded down to whole installs.
At $500 a month: about 133 installs at $3.76, 235 at $2.12, or 892 at $0.56. At the 2.0% median install to paid conversion, the Apple Ads case brings two or three paying users. That is a learning budget, not a growth budget. It tells you your real CPI and your real conversion, and that is worth $500.
At $2,000 a month: about 531 installs at $3.76, 943 at $2.12, or 3,571 at $0.56. On Google App campaigns this is below the 50 times rule for most iOS targets (a $3.76 tCPI wants $5,640 a month), so put it in one place, such as Apple Ads Basic, where you set the maximum cost per install yourself and the monthly cap is $10,000.
At $10,000 a month: about 2,659 installs at $3.76 or 4,716 at $2.12. At this level paid installs can be a real channel, but only if your revenue per install supports the price. At the RevenueCat median of $0.34 by day 60, 2,659 Apple Ads installs would return about $904 in their first two months (derived: 2,659 × $0.34).
If those numbers sting, that is the point. Our startup marketing budget page lays out line by line budgets from $0 a month upward and explains where paid installs fit, and how to market an app gives the order of channels by stage. For a solo developer, indie app marketing shows how to keep the time cost of free channels small.
For comparison, the organic social line costs far less than one week of paid installs. Spreadcast Pro is $29 a month or $290 a year, about what eight Apple Ads installs cost at the average (derived: $29 ÷ $3.76 = 7.7), and it includes clean posts with no cap, publishing to 10 social accounts across any mix of networks, autopilot or one tap approval, and posting from Claude or ChatGPT. If you want to try the channel before committing, the Post Pack is $19 once for 10 posts designed and published. Plans are on the pricing page.
How to Measure Your Own Cost per Install
Published benchmarks are where you start. Your own CPI is what you manage. Three habits make it trustworthy.
First, measure in one place. Ad platforms each claim the installs they touched, so the sum of their reported installs is usually more than your real total. AppsFlyer's glossary notes that self reporting networks such as Meta and Google charge on engagement whether or not they won the last touch, so their eCPI often differs from the attribution provider's. For a small app without a measurement partner, App Store Connect is the neutral referee: campaign links and Apple Ads attribution show up there next to your total downloads.
Second, report paid CPI and blended CPI side by side, every month, with the definition written next to the number. Paid CPI is spend ÷ attributed paid installs. Blended CPI is all acquisition spend ÷ all new installs. The gap between them is the value of your free channels.
Third, judge CPI by cohort, not by day. A campaign can look expensive on day one and cheap on day 90 if its users pay more. Apple's Cohorts report shows Download to Paid and Proceeds per Download by month of install, which is enough to compare a paid month with an organic one without any extra tool.
If social posts are one of your channels, track them as seriously as ads. Follower growth, interactions and reach per network tell you whether the audience is growing; campaign links tell you whether it installs. Our social media KPIs page lists what to track and how, and the engagement rate calculator checks whether posts land at all. If Spreadcast publishes your posts, its Analytics already shows followers and interactions per network and likes, comments, reach and views per post, so the only thing you add is the campaign link.
Where Spreadcast Fits in Your Cost per Install
Spreadcast is marketing automation for social media, built first for App Store apps. It does not buy installs. It sits on the other side of your acquisition plan: the steady organic posts that bring people to your product page without a cost per tap, which lowers blended CPI and gives paid campaigns a warmer audience to work with. Our page on mobile app marketing shows how it runs week to week.
Here is the before. A release ships. Someone opens a design tool, finds the brand colors, drops a screenshot into a phone frame, writes a caption, shortens it for Threads and Bluesky, exports four sizes and logs into four apps to post. Three days later it happens again, or more often it does not. Those hours never appear in your CPI, and the gap they leave is filled with paid installs at $2 to $4 each.
Here is the after. You paste your App Store link at /start, or a website or short description if you have no app. Spreadcast builds the brand kit from the listing and checks the listing daily. When a new version goes live or the app hits a ratings milestone, it designs the post, writes a caption for each network and publishes, on full autopilot or after one tap of approval. For anything else you start from one line in Create, or from twelve post types for apps such as a testimonial, a how to or a feature, and it designs single image posts and carousels in your brand. You can also upload your own pictures and video to schedule.
Posts go to Instagram, Facebook, Threads, LinkedIn, Pinterest, TikTok, YouTube, Bluesky, Mastodon, Telegram and Discord from one calendar, and Analytics shows followers and interactions per network plus likes, comments, reach and views per post. If you work in Claude or ChatGPT, the Spreadcast MCP server lets the assistant design, schedule and approve posts and read those numbers without leaving the chat.
Pricing is flat, which makes the cost easy to put into a blended CPI. Free is $0 for one app and makes 3 posts to download with a small Spreadcast mark (no publishing). Pro is $29 a month or $290 a year, with clean posts, no cap and publishing to 10 social accounts. Studio is $79 a month for 5 apps and 50 accounts, each with its own brand. The 30 Day Pass is $39 once for everything in Pro for 30 days, and paid plans have a 7 day full refund. Add a campaign link to the posts and divide the plan price by the downloads they bring: that is your organic cost per install. See features for the full list, or start with your App Store link.
Cost per Install Terms in Plain Words
The abbreviations around CPI, so a report or an agency proposal reads clearly.
| Term | Meaning |
|---|---|
| CPI | Cost per install: ad spend divided by installs, or a price paid per install. |
| eCPI | Effective cost per install after the campaign; sometimes counts organic installs too. |
| Blended CPI | All acquisition spend divided by all new installs, paid and organic. |
| CPT | Cost per tap, the Apple Ads Advanced billing unit. |
| CPA | Cost per acquisition or action: a download on Apple Ads reports, or an event after install. |
| IPM | Installs per thousand impressions; links CPM to CPI. |
| RPI | Revenue per install: total revenue divided by installs. |
| ROAS | Return on ad spend: revenue from paid users divided by spend, often at day 7, 30 or 90. |
| MMP | Mobile measurement partner, such as AppsFlyer or Adjust, that attributes installs to sources. |
| ATT | App Tracking Transparency, Apple's permission prompt for tracking across other companies' apps. |
| UA | User acquisition: the work and spend of getting new users. |
Frequently Asked Questions
What is cost per install?
Cost per install (CPI) is what you pay in advertising for one app install: total ad spend divided by the installs it brought. It is also the name of a pricing model where an advertiser pays a network a fixed price for each install.
What is the average cost per install in 2026?
It depends on who measures it. Adjust's shopping report puts the global median for shopping apps at $1.08 in the first half of 2026. Adjust's all app medians were $1.74 on iOS and $0.56 on Android in early 2024. SplitMetrics puts the Apple Ads average at $3.76 for 2025.
What is the cost per install in the USA?
The most recent public figure is $3.28 for shopping apps in the first half of 2026, from Adjust's shopping report. Across all app categories, Adjust's North America median eCPI was $2.12 in early 2024, with games at $2.14 and health and fitness at $1.19.
How do you calculate cost per install?
Divide ad spend by the installs attributed to it. $1,000 of spend and 400 installs is a CPI of $2.50. For Apple Ads Advanced, CPI equals cost per tap divided by the tap to install conversion rate.
Why is CPI higher on iOS than Android?
iOS users are concentrated in higher income markets and spend more in apps, so advertisers bid more for them. App Tracking Transparency also limits targeting on iOS. RevenueCat's data shows iOS installs earning more too, so the higher price can still pay back.
What is a good cost per install?
One your installs pay back within a time your cash can wait. Compare your CPI with your own revenue per install at day 60 or day 180, not with another app's CPI. RevenueCat's median is $0.34 per install by day 60.
What is the difference between CPI and eCPI?
CPI is a fixed price per install agreed before a campaign, or spend divided by installs. eCPI is the effective cost after the campaign, and some definitions count organic installs the ads caused, which makes it lower than paid CPI.
Does Apple Search Ads charge per install?
Apple Ads Basic charges only for installs, at a maximum cost per install you choose, with a budget of up to $10,000 a month per app. Apple Ads Advanced charges per tap, up to a maximum cost per tap you set.
Which countries have the cheapest cost per install?
In Adjust's data, MENA ($0.15) and Latin America ($0.18) had the lowest median eCPI in early 2024, and India had the cheapest shopping app installs in 2026 at $0.10. Revenue per install is also far lower in those markets.
Where These Facts Come From
Every outside number, rule and price on this page links to the page it was taken from.
- Must know eCPI benchmarks for app marketers (July 30, 2024)Adjust
- What is cost per install (CPI)Adjust
- Mobile app trends: 2026 editionAdjust
- The shopping app insights report: 2026 editionAdjust
- UK and Ireland app install costs gain 80% to $3.85 (August 27, 2026)PPC Land
- Cost per install glossaryAppsFlyer
- Top 5 data trends of 2025 and predictions for 2026AppsFlyer
- 2025 Casual Gaming Apps ReportLiftoff
- Highlights from the 2025 Casual Gaming Apps ReportLiftoff
- Apple Ads cost: CPA, CPT, CR and TTR benchmarks for 2026 (September 14, 2026)SplitMetrics
- State of Subscription Apps 2026RevenueCat
- Apple Ads BasicApple Ads
- Compare Apple Ads solutionsApple Ads
- Set and adjust bidsApple Ads
- Custom product pagesApple Developer
- Campaign links in App Store Connect AnalyticsApple Developer
- Cohorts in App Store Connect AnalyticsApple Developer
- User privacy and data useApple Developer
- Choose a bid strategy for your App campaignGoogle Ads Help
- Best practices for App campaignsGoogle Ads Help
- About bid strategiesMeta Business Help Center
- Facebook and Instagram ads pricingMeta for Business
- Video: Apple Search Ads, the real secret to stable app growthBusiness of Apps
- Video: Driving iOS App campaign performanceGoogle Ads
- Video: 7 app marketing strategies to drive installs and lower CPIsAppsFlyer
Researched and written by Spreadcast. Last checked on October 28, 2026.