What Is a Social Media Audit?
A social media audit is a structured review of every social account a brand owns. You list the accounts, check who can log in, read each profile the way a stranger would, pull the numbers for a fixed period, rank the posts, count how often you actually posted and look at whether the feed reads as one brand. Then you write down what to fix. Done properly it takes an afternoon for a small brand and a couple of days for a company with a dozen accounts.
The point is not the spreadsheet. The point is the short list of changes at the end of it. Most audits we have seen fail because they stop at the numbers: a tab of follower counts nobody reads again. A useful social media audit ends with five to ten fixes, each with an owner and a date, and a baseline you can compare against in three months.
This page gives you everything you need to run one yourself: a 10 step checklist, a social media audit template you can paste into Google Sheets or Excel, a filled in social media audit example for a small app, where each of the 11 big networks keeps its analytics, and a visual consistency check that most free templates skip. That last check matters more than people think. A feed with three fonts, two logos and stretched screenshots loses trust before anyone reads a caption, and no analytics dashboard will flag it for you.
If you are here for numbers only, our guide to social media KPIs covers the 20 metrics worth tracking with formulas, and the engagement rate calculator does the arithmetic per network. This page is about the audit itself: the order of work, what to look at and what to write down.
Key Takeaways
Accounts Before Analytics
Start by listing every account and every person with access. Forgotten profiles and former staff with admin rights are the most common findings, and they are the riskiest.
Pick One Period
Audit the same window on every network, usually the last 90 days. Native tools keep different histories: Pinterest offers about a year and a half, Buffer's free plan 30 days.
Followers, Interactions, Reach
Record these three first on every network. They are the numbers every native dashboard shows, so the audit stays comparable from one quarter to the next.
Benchmarks Disagree
Buffer puts the median Instagram engagement rate at about 5.5% of reach; Rival IQ puts it at 0.30% of followers. Compare yourself only against a benchmark that uses your formula.
Check How It Looks
Score logo, colors, fonts, screenshots, image sizes, text contrast and profiles. Visual drift is the finding that analytics never surface and that readers notice first.
End With Fixes
A finished audit is a one page report: what you found, five to ten fixes with owners and dates, and the baseline numbers you will compare against next quarter.
How We Researched This
We built this checklist from the audits we run on our own accounts and on the brand kits people create in Spreadcast, then checked every platform detail against the platform's own help pages on October 28, 2026. For where the numbers live we used Instagram's help on insights and Account Status, LinkedIn's Page analytics help, YouTube's Analytics guide, Pinterest's analytics help, Meta's Threads Insights API reference and Telegram's channel statistics documentation.
For access and security we used Meta's help on adding people to a business portfolio, LinkedIn's Page admin roles and YouTube's channel permissions. For traffic we used Google's help on campaign URLs and the default channel group, plus Apple's help on App Store campaign links. For benchmarks we used the 2026 Rival IQ report and Buffer's 2026 engagement study; for audience fit, Pew Research Center and DataReportal. Tool prices come from each vendor's own pricing page on the same day.
The filled in example further down is made up for this page. It shows how to fill in the template; it is not data from a real company. Every other number on the page links to where it came from, and every source is listed at the bottom.
The Social Media Audit Checklist at a Glance
Ten steps in three groups: get the accounts in order, collect the evidence, then turn it into a plan. The order matters, because there is no point analyzing an account you might delete in step one.
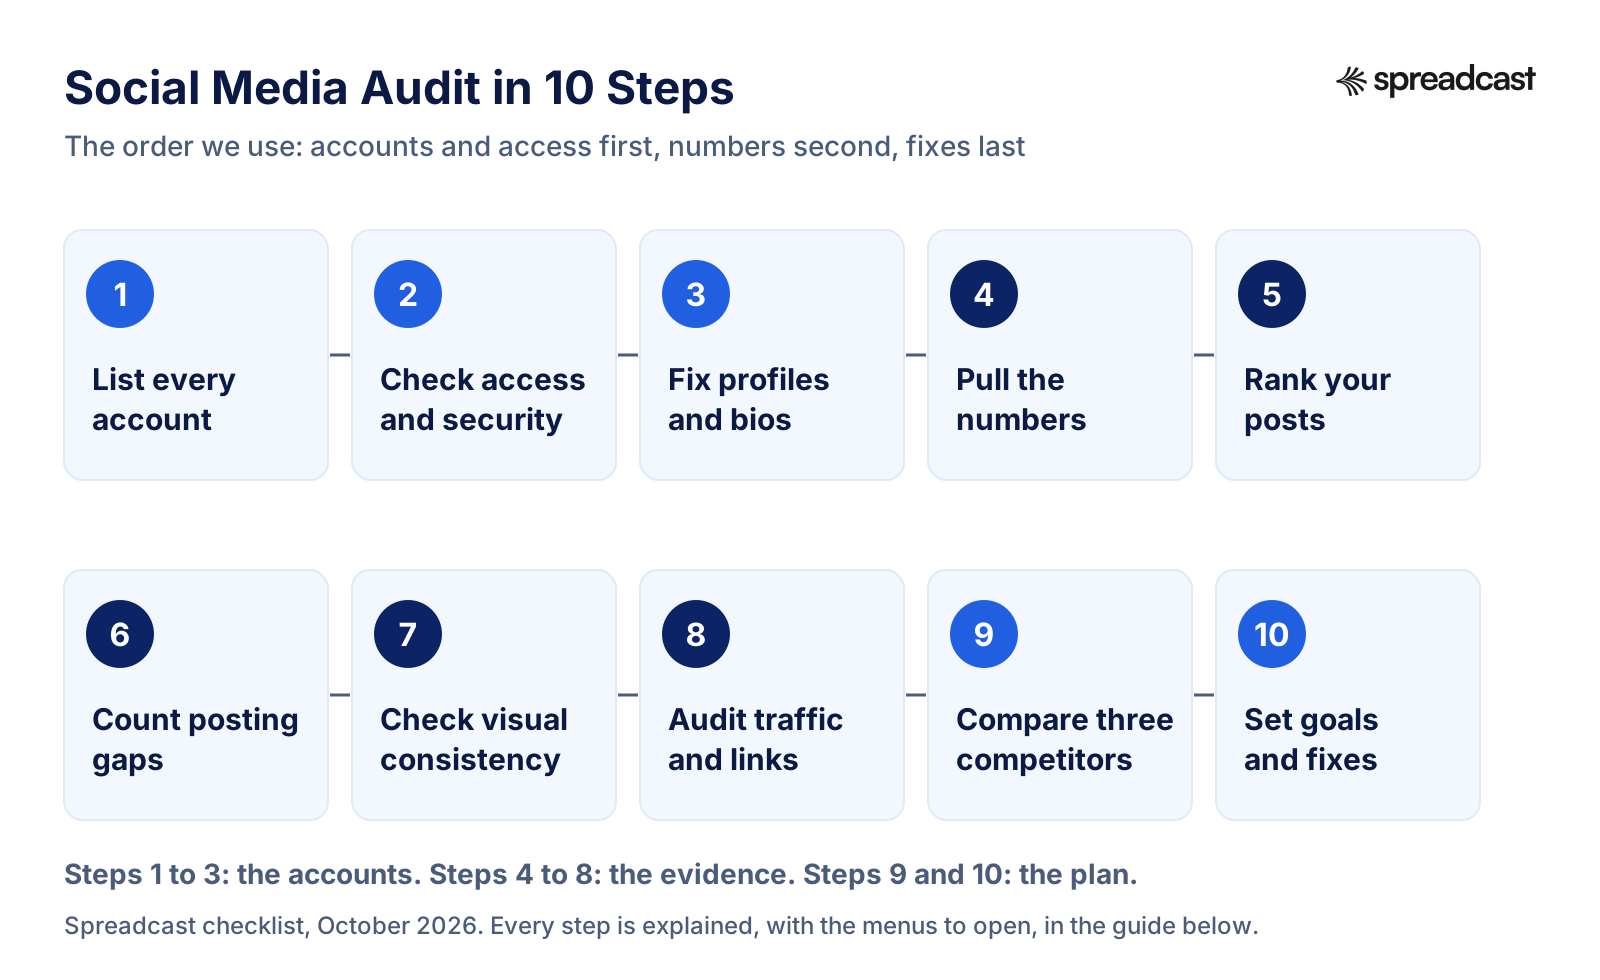
How to Do a Social Media Audit: The 10 Step Checklist
Work through the steps in order and fill in one row of the template per account as you go. Set aside two to four hours for a brand with five accounts.
- Step 1
List Every Account Your Brand Owns
Search each network for your brand name, product name and old names, and check the footer of your website, your App Store listing and old email signatures for profile links. Write down every account you find, including the ones you stopped using. Mark each one keep, merge or close. An abandoned account with your logo is worse than no account, because it tells a visitor you gave up.
- Step 2
Check Who Has Access and How They Log In
For each account, write down who can log in, with which role, and whether two factor authentication is on. On Meta, open Settings, then People in Meta Business Suite; on LinkedIn, check Page admin roles; on YouTube, check channel permissions. Remove anyone who left. Move shared passwords into a password manager.
- Step 3
Read Every Profile Like a Stranger
Open each profile logged out, on a phone. Check the name, handle, profile picture, bio, link and pinned post. Is the handle the same everywhere? Does the bio say what the product does in plain words? Does the link work and land on a page that matches the bio? Note every mismatch.
- Step 4
Pull the Numbers for One Fixed Period
Choose a window, usually the last 90 days, and use the same one everywhere. For each account record followers at the start and end, total interactions, total reach or views, number of posts and the top three posts. Write the date you pulled the numbers, because native dashboards change what they show.
- Step 5
Rank Your Posts and Tag Why They Worked
Sort the period's posts by interactions and by reach. For the top five and bottom five, tag the format (single image, carousel, video, text), the topic and the hook. Patterns show up fast: one topic that always works, one format that never does.
- Step 6
Count the Posting Gaps
Count posts per week per account and find the longest gap. Most small brands do not have a content problem; they have a consistency problem. A feed that posted 12 times in March and twice in May looks abandoned to anyone who visits in June.
- Step 7
Score Visual Consistency
Open the last nine posts on each network side by side. Score logo, colors, fonts, screenshots, image sizes, text contrast and the profile set from 0 to 2. Anything scoring 0 goes to the top of the fix list, ahead of any new campaign.
- Step 8
Audit the Traffic Social Sends
Check what social sends to your website or App Store page. In Google Analytics, look at the Organic Social channel. For an app, use App Store campaign links so each network gets its own row. Untagged links are the most common reason this step comes up empty.
- Step 9
Compare Three Competitors
Pick three accounts in your space, ideally one bigger, one similar and one smaller. Run steps three, five, six and seven on them using only what is public: profiles, post counts, formats and how their feed looks. Write down one thing each does better than you.
- Step 10
Write the Fix List and Set Goals
Turn the findings into five to ten fixes, each with an owner and a date. Then set one goal per kept network for the next quarter, in the same three numbers you recorded: followers, interactions and reach. Book the next audit in the calendar before you close the sheet.
Social Media Audit Template: Copy These Columns Into a Sheet
One row per account. Paste the column names into Google Sheets or Excel, fill one row as you go through the steps, and keep each quarter on its own tab so you can compare. This is the whole social media audit template; you do not need a download.
| Column | What to write | Where to find it |
|---|---|---|
| Network | Instagram, Facebook, Threads, LinkedIn, Pinterest, TikTok, YouTube, Bluesky, Mastodon, Telegram, Discord | Your list from step one |
| Profile link and handle | The full URL and the @handle exactly as shown | The profile, opened logged out |
| Status | Keep, merge or close | Your decision in step one |
| Owner and admins | Names and roles of everyone with access | Business portfolio, Page admin roles, channel permissions |
| Two factor on? | Yes or no for the main login | Account security settings |
| Bio and link check | Pass or fix, with the problem in a few words | The profile on a phone |
| Followers at start and end | Two numbers, plus the change | Native analytics, follower or audience tab |
| Interactions | Total likes, comments, shares, saves and replies for the period | Native analytics, content tab |
| Reach or views | Total for the period, and say which one the network reports | Native analytics, overview tab |
| Posts in period | Count, and posts per week | Your profile grid or the content tab |
| Longest gap | Days between two posts | Your profile grid |
| Top three posts | Links, with format and topic for each | Content tab sorted by interactions |
| Visual score | 0 to 14 from the seven row check | Your last nine posts side by side |
| Clicks or visits from social | Sessions or App Store page views from this network | Google Analytics, App Store Connect campaigns |
| Fixes | One line per fix, with owner and date | Your findings |
Pull every number for the same period and write the date you pulled it. Native dashboards revise recent numbers for a few days, so avoid ending the window yesterday.
Step 1 in Detail: How to Find Every Account Your Brand Owns
The first job in any social media audit is an inventory, and it is almost always longer than people expect. Brands collect accounts the way houses collect cables: a Pinterest board someone made for a launch, a YouTube channel from a conference talk, a Threads profile created automatically from Instagram, a Mastodon account an engineer set up during a busy week on another network. Each of those still carries your name.
Search every network for your brand name, your product name, your domain and any old names. Then look at the places that link to your profiles: your website footer, your App Store or Google Play listing, your email signature, press kit, old blog posts and partner pages. If a link points at an account you do not recognize, add it to the list and find out who made it.
For each account, make one decision. Keep means you will post there at least weekly for the next quarter. Merge means you will point people to another account and stop posting. Close means you will delete it, or at least archive it with a pinned post saying where you moved. Be honest here. Five accounts you post to every week beat eleven accounts you post to when you remember.
Before you close anything, export what is there. Instagram lets you review and export a copy of your information, which gives you every post and caption in one download. That archive is also handy for step five, because ranking posts is easier in a file than in an app.
A practical tip from our own audits: also search for impostor accounts. A profile using your logo and a slightly different handle is common for apps that get any traction, and it is easier to report one when you find it in an audit than when a customer emails you about it.
Step 2 in Detail: Access and Security in a Social Media Audit
Access is the part of a social media audit that agencies skip and that causes the worst surprises. The questions are simple. Who can log in to each account? With what role? Does the main login use two factor authentication? Is the recovery email one the company controls, or a former intern's personal address?
On Facebook and Instagram, access runs through a Meta business portfolio. Meta's help on adding people to a business portfolio says you need full control of the portfolio to manage people, that people get basic access by default, and that you should assign only the level of access people need. It also suggests turning on two factor authentication for the portfolio. In practice, open Settings in Meta Business Suite, click People, and go down the list. Anyone who left gets removed today, not after the audit.
On Instagram itself, check two factor authentication through the Accounts Center. Instagram's help page on securing your Meta account with two factor authentication walks through the options. An authenticator app beats text messages; a security key beats both.
LinkedIn uses named roles. According to LinkedIn's help on Page admin roles, a Super admin has every permission, a Content admin creates and manages posts and events, and an Analyst can only see the Analytics tab. That last role is perfect for an outside auditor or a freelancer who needs numbers but should not post. YouTube has its own ladder. YouTube's channel permissions run from Owner and Manager down through Editor, Editor (Limited), Subtitle Editor, Viewer and Viewer (Limited). Give an auditor Viewer (Limited) and they can see the channel without touching revenue or uploads.
Write every name and role in the template's Owner and admins column. The finding we see most often is not a hacked account but an account nobody current can fully control: one person holds the only admin login, and they left. Fixing that before it becomes urgent is the cheapest win in the whole audit.
Step 3 in Detail: Profile and Bio Checklist
Open each profile logged out, on a phone, and read it as if you had never heard of the brand. That is how most people meet you: a profile tap from a comment, a share or a search. You have about one screen to say what you are.
Check six things on every profile. The display name should be the brand name people search for, not a tagline. The handle should be the same on every network, or as close as availability allows. The profile picture should be the same mark everywhere, cropped so it still reads inside a circle. The bio should say what the product does and for whom, in plain words. The link should work, load fast on a phone and land on a page that matches the bio. And the pinned post, if the network has one, should still be current.
Links deserve a closer look. Instagram has allowed up to five links in a bio since April 2023, so put the one that matters most first and remove the ones you no longer need. Mastodon can show a verified checkmark beside a link: per Mastodon's profile documentation, a link is verified when the page it points to links back to your profile with a rel="me" attribute. It also allows a 500 character bio by default and four extra profile fields. On Bluesky, you can use your own domain as your handle by adding a DNS record, which is the clearest proof that an account is really yours.
Character limits vary a lot between networks, so a bio written for Mastodon will not fit Instagram or TikTok. Our page on social media character limits lists every bio, name and caption limit by network if you are rewriting several at once.
Score each profile pass or fix in the template and write the problem in a few words: wrong link, old logo, bio describes a feature you removed. Keep it short. The audit report is a list of fixes, not an essay.
Where Each Network Keeps Its Numbers
Every network reports differently and keeps a different amount of history. This table tells you where to click for each of the 11 networks and what to watch for when you copy numbers into the template.
| Network | Where the numbers are | What to know before you copy them |
|---|---|---|
| Insights in the app, or Meta Business Suite on desktop (Instagram help) | Professional accounts only. Check Account Status too, it shows whether your content can be recommended. | |
| Insights in Meta Business Suite | Facebook and Instagram sit side by side, so pull both in one sitting. | |
| Threads | Insights from your profile; developers read the same data through the Threads Insights API | Follower demographics need at least 100 followers. Through the API, data starts in April 2024. |
| Analytics in the Page admin view (LinkedIn help) | Seven analytics types, including Competitors. Every admin role can see them. | |
| Analytics in a business account (Pinterest help) | Custom ranges go back about a year and a half, and you can export a CSV. | |
| TikTok | Analytics in TikTok Studio, on the web or in the app | Check which date ranges your account offers and copy the numbers every quarter, since older data may not stay available. |
| YouTube | Analytics in YouTube Studio (YouTube help) | Advanced Mode lets you compare periods and export the data. |
| Bluesky | No analytics dashboard in the app when we checked; count likes, reposts and replies per post | Use a tool or a spreadsheet. Buffer's study tracks interactions per post here instead of a rate. |
| Mastodon | No analytics dashboard; each post shows boosts, favorites and replies | Followers show on the profile. Count per post interactions by hand or with a tool. |
| Telegram | Statistics in the channel settings (Telegram docs) | Only for channels above a size Telegram sets on its servers. Views and shares per post are the key numbers. |
| Discord | Your server's member count and the reactions and replies in your announcements channel | Reach as other networks define it does not apply. Track members and reactions per post over time. |
Checked on October 28, 2026. Menu names move often; if a tab is missing, search the network's help center for analytics.
Step 4 in Detail: Which Numbers to Pull, and for What Period
Pick one period and use it on every account. Ninety days is our default: long enough to smooth out one viral post or one quiet week, short enough that the content still reflects your current product. If this is your first social media audit ever, also pull the previous 90 days so you have a trend, not a single point.
Record three headline numbers first on every network: followers, interactions and reach. Followers at the start and end of the period tell you whether the audience grows. Interactions (likes, comments, shares, saves, replies, reposts) tell you whether people respond. Reach, or views where reach is not reported, tells you how many people saw anything at all. These three exist on almost every network, so they are the numbers you can compare across accounts and across quarters.
After those, add posts per week and the top three posts by interactions. If your goal is traffic or installs, add clicks and visits, covered in step eight. Our guide to social media KPIs explains the other metrics, such as saves, watch time and response time, if you need them for a specific goal. And if you want engagement rates, run the numbers through the engagement rate calculator rather than doing the division by hand for eleven networks.
Watch the history limits. Pinterest's analytics, per its help center, let you view custom ranges for the past year and a half plus real time estimates for the last 48 hours. Free scheduling tools often keep far less: Buffer's free plan keeps 30 days of insights history, and Metricool's free plan also shows 30 days. If you plan to audit quarterly, export or copy the numbers each time, because next quarter you may not be able to get them back.
Write down the date you pulled every number. Platforms revise recent figures, change definitions and occasionally rename metrics. When views replace impressions on a network halfway through your year, the date in your sheet is the only way to explain the jump.
Video: Reading Channel Analytics in the YouTube App
YouTube's own creator team shows where channel and video analytics live in the main YouTube app, with separate views for videos, Shorts and live streams. It is a good model for any network: find the overview first, then the per post view.

Instagram Account Status: The Check Most Social Media Audits Miss
If a brand's Instagram reach has dropped and nobody knows why, open Account Status before you change anything else. Instagram's help on Account Status says professional accounts can see there whether their content may be eligible to be recommended to people who do not follow them. From the same screen you can view a sample of posts that went against the Recommendations Guidelines, edit or remove them, or request a review if you disagree.
Instagram is careful to say that eligibility does not guarantee recommendation, and that ineligible accounts still reach their existing followers. But an account that has been marked as not eligible will see its reach outside the follower base fall, and no amount of posting at better times will fix that. In an audit, write the status in the template's Fixes column if it is anything other than fine.
Facebook, YouTube and TikTok have their own screens for guideline strikes and warnings. They are worth a click each during step four, especially if you post content from other people, music or anything that looks like a giveaway.
Step 5 in Detail: Content Audit, Which Posts Worked and Why
The content part of a social media audit answers one question: what should we make more of? Sort the period's posts by interactions, then by reach. Take the top five and the bottom five on each network and tag each one with three labels: format (single image, carousel, video, text only), topic (product update, tip, behind the scenes, customer quote, offer) and hook (the first line or the first frame).
Patterns appear within a dozen posts. On our own accounts, posts that show the product doing one specific thing beat posts that describe it, and carousels that teach one thing beat carousels that list ten. Your patterns will differ. The point is to write them down so the next quarter's plan is based on what your audience did, not on what a trend article said.
Look at the bottom five just as closely. A post that flopped is often a design problem rather than a topic problem: text too small to read on a phone, a screenshot so busy nobody can tell what to look at, or an image cropped badly on one network because it was made for another. Our breakdown of what makes a good social media post and the 35 creatives we analyzed give you a vocabulary for those notes.
If you run an app, check whether your posts show the app at all. Raw screenshots dropped into a square tend to read as a slideshow, a problem we cover in why app feeds look like a slideshow. And if the audit shows you mostly post when you remember, our list of 52 post ideas for apps is a quick way to fill the next quarter.
Finally, check the captions against each network's habits. A caption written for LinkedIn rarely works on Threads, and the same hashtag block on every network is a sign the posts were copied, not adapted. Note it in the template; it becomes a fix in step ten.
Engagement Rate Benchmarks to Compare Your Audit Against
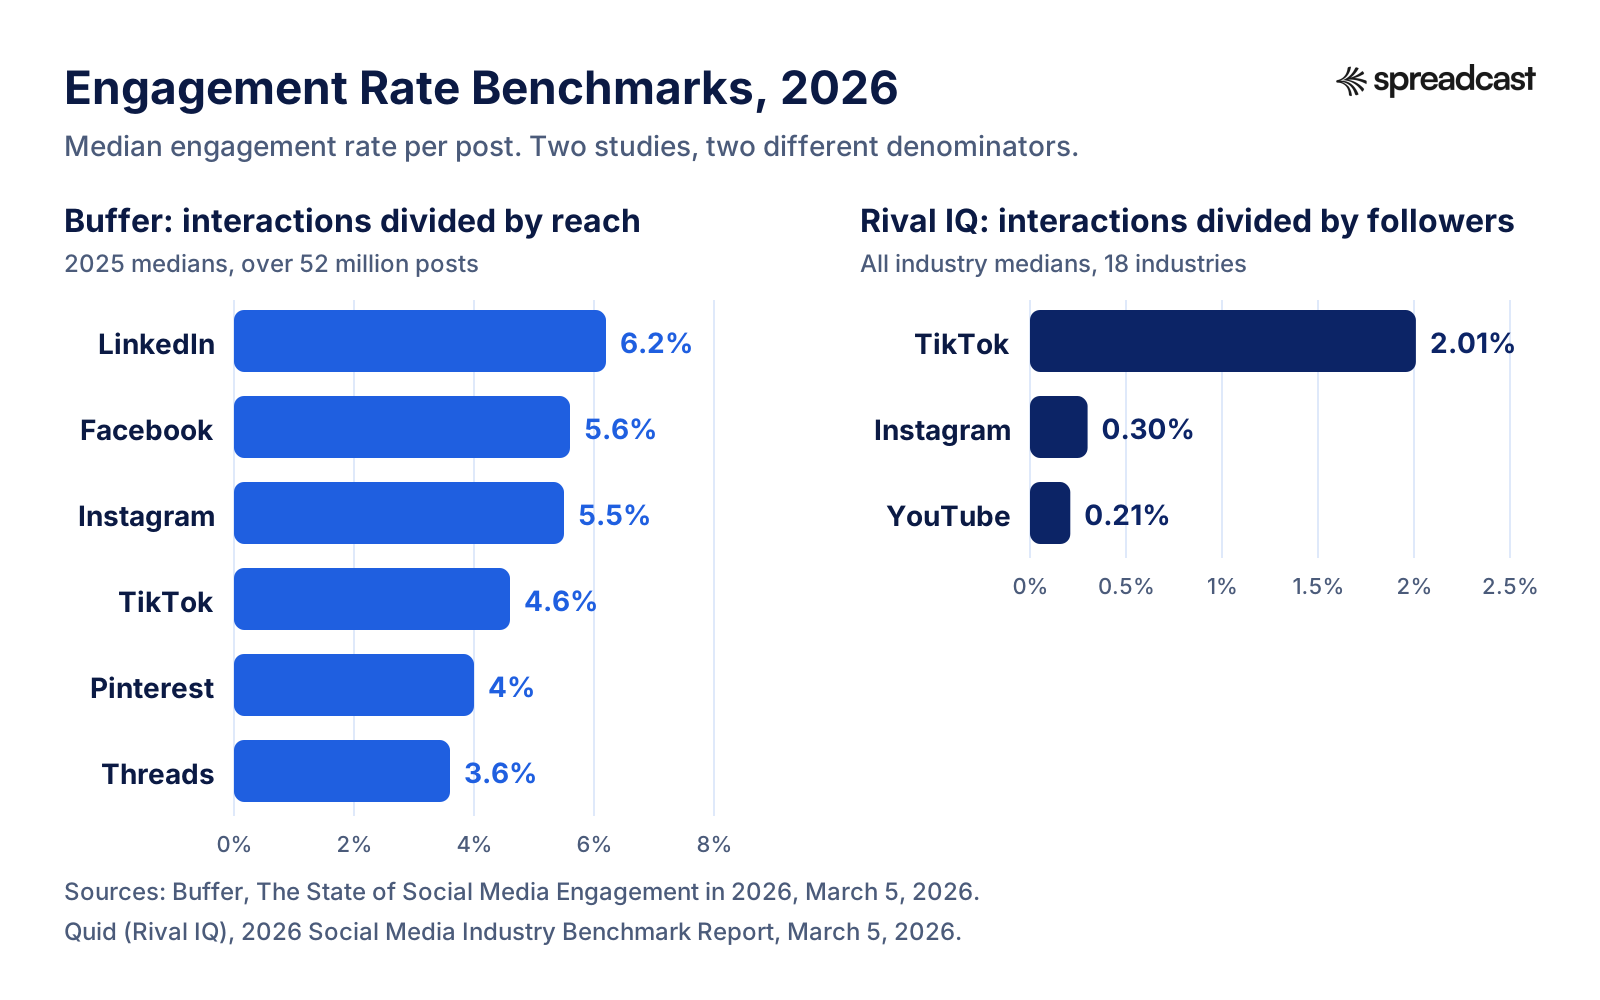
Two respected 2026 studies, two very different numbers for the same networks, because one divides by reach and the other by followers. Use the one that matches how you calculate your own rate.
How to Read Benchmarks Without Fooling Yourself
Benchmarks are the part of a social media audit most likely to mislead. Buffer's 2026 study looked at more than 52 million posts across 10 platforms and divides engagements by reach. Its 2025 medians are about 6.2% on LinkedIn, 5.6% on Facebook, 5.5% on Instagram, 4.6% on TikTok, 4.0% on Pinterest and 3.6% on Threads. Buffer notes that LinkedIn's rate includes clicks, which partly explains why it tops the list.
The 2026 Rival IQ report, now published by Quid, samples 150 companies in each of 18 industries and divides interactions by followers. Its all industry medians are 0.30% per post on Instagram, 2.01% on TikTok and 0.21% on YouTube. Same networks, numbers that differ by a factor of ten or more, and both are correct for their formula.
So the rule for your audit is simple: decide on one formula, use it on every account, and only compare yourself to a benchmark that uses the same one. If your native tools give you reach, compare against Buffer. If you only have follower counts, compare against Rival IQ. Write the formula at the top of your template so the next person who runs the audit uses it too.
Some networks do not fit a rate at all. Buffer reports Bluesky and Mastodon as interactions per post, with medians of about 4 and 3, and YouTube as views per video. For those, record the raw counts and compare each quarter against your own last audit. Your previous quarter is the most honest benchmark you have anyway.
Posting frequency benchmarks help with step six. Rival IQ's medians are about 3.7 posts a week on Instagram, 3 on Facebook and 2 videos a week on TikTok. If your audit shows one post a fortnight, that gap is a bigger issue than any engagement rate.
Step 6 in Detail: Posting Consistency and the Gaps Nobody Counts
Count posts per week on each account for the period, then find the longest gap between two posts. Put both numbers in the template. This takes ten minutes and is often the most useful finding in the whole audit, because it explains most of the other numbers. Reach falls when you stop posting. Followers stall. The few posts you do publish get less traction because the account looks inactive to both people and ranking systems.
Look for the shape of the gaps too. Do posts bunch around launches and vanish in between? Does one network get everything and the others get leftovers a week later? Is there a pattern of posting on Mondays and then nothing? Each pattern has a different fix: a content calendar, batching, or handing the posting to a tool.
Most small teams know the answer before they finish counting. Nobody had time to design a post. That is not a discipline problem; it is a capacity problem. A social media content calendar helps you plan, and batching a month of content in one afternoon helps you produce. But if the audit shows the gaps line up with busy weeks every time, planning harder will not fix it.
This is the gap Spreadcast was built for. If your audit shows posts bunched around releases and nothing in between, Spreadcast watches your App Store listing every day, and when a new version goes live or the app reaches a ratings milestone, it designs the post in your brand, writes a caption for each network and publishes it, either on full autopilot or after one tap of approval. You can see what each plan includes on the pricing page.
The Visual Consistency Check Most Social Media Audits Skip
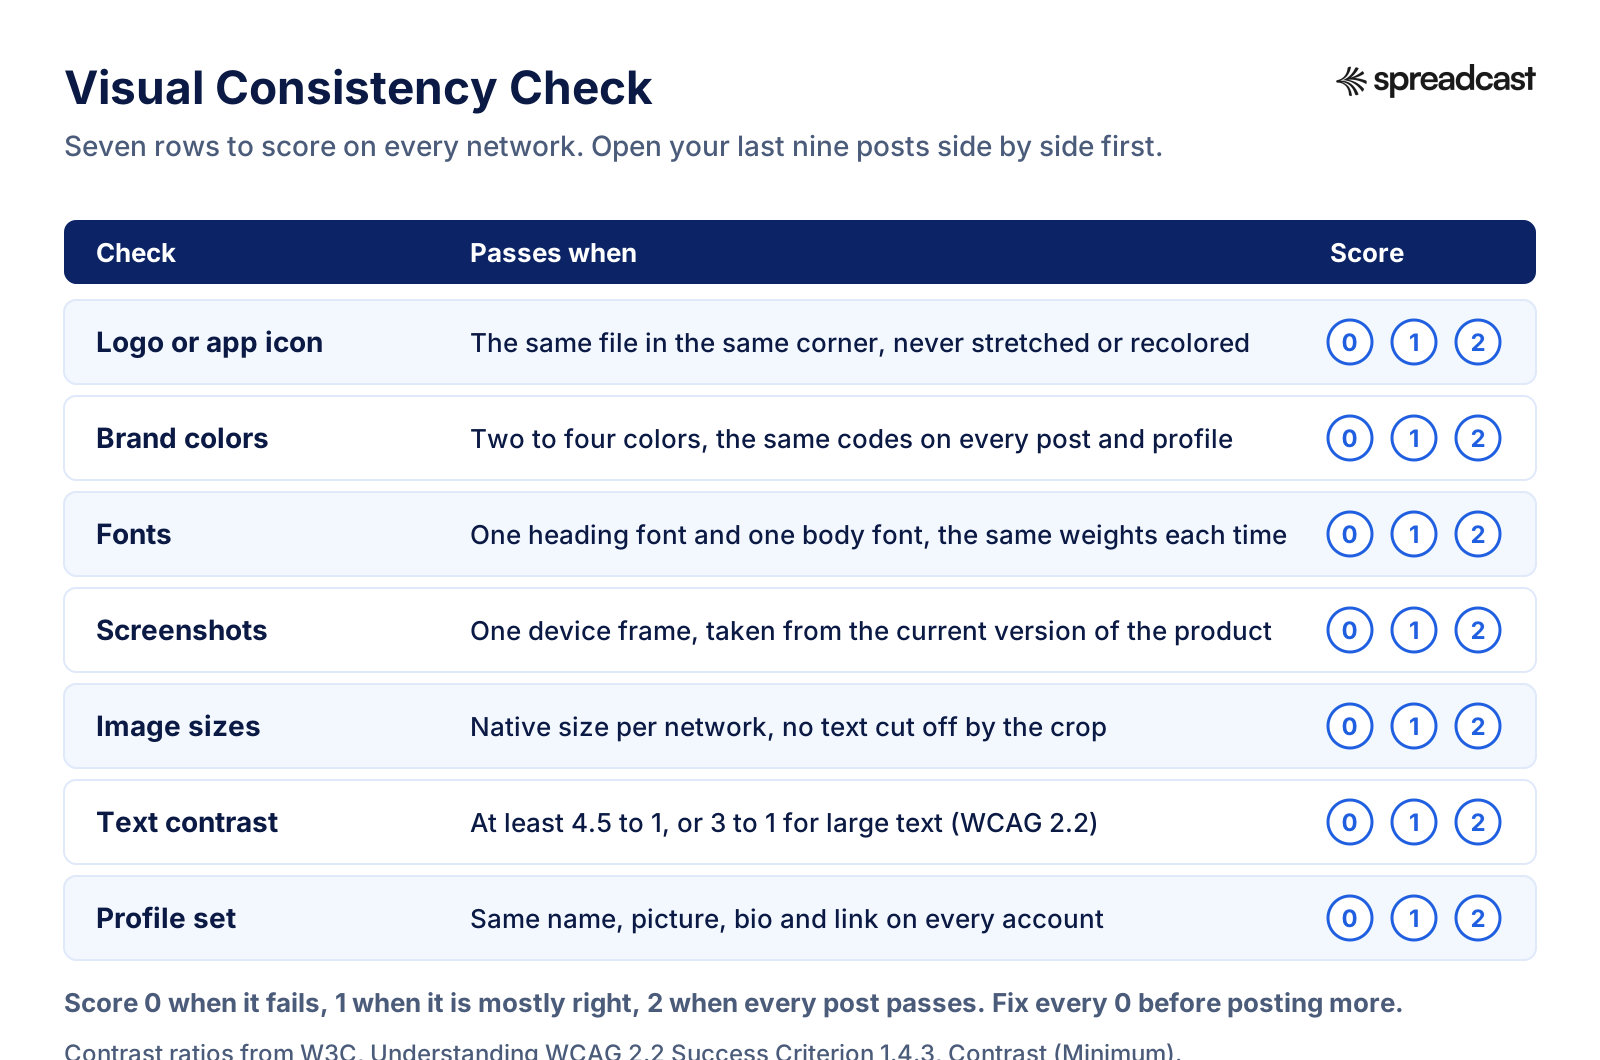
Free audit templates ask about followers and engagement and stop there. This scorecard asks whether your feed looks like one brand. Score each row 0, 1 or 2 per network.
Step 7 in Detail: How to Run a Visual Consistency Check
Open the last nine posts on each network side by side. On Instagram the grid already does this; on other networks, take screenshots and paste them into one slide or one sheet. Nine is enough to see a pattern and few enough to finish in five minutes per account. Then score the seven rows on the scorecard.
Logo or app icon. Is it the same file every time, in the same corner, at a similar size? Watch for old versions of the logo that survived a redesign, logos stretched to fit, and logos recolored to match a background. Score 0 if you find two different logos in nine posts.
Brand colors. Pick out the colors in each post. A consistent feed uses two to four colors with the same codes every time. The common failure is near misses: four slightly different blues because each post was made from a different template. Score 0 if you cannot name your brand colors from the feed alone.
Fonts. Count the typefaces. One for headings and one for body text is plenty. A feed that switches between three or four fonts reads as several brands, even when the colors match. Note the worst offender by name, because it usually traces back to one template or one person.
Screenshots. For apps and software this is the biggest one. Are screenshots in the same device frame, from the current version of the product, at a size where the interface can actually be read? Mixed frames, outdated screens and screenshots shrunk into a corner all score low. Our free iPhone mockup generator puts a screenshot into a clean frame if you need to fix a few by hand.
Image sizes. Is each post made at the network's native size, or was a square posted everywhere? Look for text cut off by crops, especially on Pinterest pins, LinkedIn previews and Instagram's 4:5 portrait posts. The current pixel sizes for every network are on our social media image sizes page.
Text contrast. Can the text on each image be read on a phone in daylight? W3C's guidance for minimum contrast is a ratio of at least 4.5 to 1 for normal text and 3 to 1 for large text, defined as at least 18 point, or 14 point bold. Text that is part of a logo is exempt. Pale gray on white and white on a busy photo are the usual failures. Instagram also lets you write or edit alt text for a post, so check whether your posts carry a real description or none at all.
Profile set. Same name, same picture, same bio and the same link on every network. You already checked this in step three; carry the score over so the visual total is complete. Add up the seven rows for a score out of 14 per network and put it in the template.
Video: Why Text Contrast Matters in Your Posts
A one minute film from W3C's Web Accessibility Initiative shows what low contrast text looks like to someone reading in bright light or with weaker eyesight. Watch it before you score the contrast row.

How to Fix What the Visual Check Finds
Most visual drift has one root cause: there is no written rule, so every post is a fresh decision. The fix is a one page brand style guide with the logo files, the color codes, the two fonts, the screenshot frame and the post sizes. Our brand style guide template is built for exactly this, and our guide on what a brand kit needs covers the files to keep next to it.
If you do not have a kit at all, our free brand kit generator pulls colors, fonts and the logo from a website, which gives you a starting point in a minute. Then rebuild your post templates so every one uses the kit, and retire the old ones. Keeping old templates around is how drift comes back three months later. Our article on brand consistency without a design team goes deeper into keeping it that way when several people post.
For contrast, check each template once rather than each post. Design tools now have contrast checkers built in, so you can test the text color against the background color and see whether it passes the 4.5 to 1 ratio. Fix the template and every future post passes.
This is the second place Spreadcast fits naturally. When the audit finds three fonts, two logos and screenshots in mixed frames, Spreadcast fixes it at the source: paste your App Store link at Spreadcast's start page and it builds a brand kit from the listing, with your icon, colors and screenshots in an iPhone frame, and every post it designs uses that kit. Businesses without an app can start from a website or a short description of the brand. The visual score stops depending on who made the post that week.
Video: Checking Color Contrast in a Design Tool
Figma's own team shows how to check whether text and graphics in a design meet the WCAG contrast levels, and how to fix a color that fails. The same check works on any post template.

Step 8 in Detail: Traffic Audit, What Social Sends to Your Site and App
Followers and likes are the start of the story. For most businesses the audit should also answer what social sends somewhere useful: website visits, signups, App Store page views or installs. This is the step that most often comes up empty, and almost always for the same reason: the links were never tagged.
For a website, use UTM parameters on every link you post. Google's help on campaign URLs says you should always use utm_source, utm_medium and utm_campaign, that values are case sensitive, and that lowercase should be your standard. So instagram and Instagram become two different rows in your reports if you mix them. Pick one spelling per network and write it in the template.
Google Analytics then groups the visits into channels. Per Google's default channel group, a visit counts as Organic Social when the source matches Google's list of social sites or the medium is one of a short list of values such as social, sm or social media. Paid social needs both a social source and a paid style medium. If your report shows social traffic under Referral or Unassigned, your mediums are probably inconsistent.
For an app, use App Store campaign links. You create a campaign in App Store Connect Analytics and get a link with a campaign token of up to 30 characters. Apple tracks impressions, product page views, downloads, sales and subscriptions per token, but campaigns only appear 24 hours after launch, and each metric only shows once it reaches 5 in the selected period. Our App Store campaign link generator builds one link per network in bulk so each network gets its own row.
In the template, record sessions or product page views per network for the audit period. If the numbers are tiny, that is a finding too. It usually means bios link to a home page instead of a page that matches the post, or posts carry no link at all on networks that allow one.
Step 9 in Detail: Competitor Audit With the Same Checklist
Pick three competitors or peers: one bigger than you, one about your size and one smaller or newer. Run the public parts of your checklist on them: the profile check from step three, the content ranking from step five using visible likes and comments, the posting count from step six and the visual score from step seven. Do not try to estimate their reach. You cannot see it, and guesses add noise.
Some native tools help. LinkedIn Page analytics includes a Competitors tab among its seven analytics types, which compares your Page with others you choose. Paid tools add more: Metricool's free plan analyzes up to five competitor profiles, and Hootsuite's Standard plan includes benchmarking against up to five competitors.
Write one line per competitor: the one thing they do better than you. It might be a format you never use, a posting rhythm, a visual style that makes every post recognizable, or a bio that explains the product in eight words. Those lines are the most actionable part of the competitor audit. A table of their follower counts is not.
Be careful not to copy. The aim is to find gaps in your own approach, not to look like someone else. If all three competitors post the same carousel style, doing it too will make you the fourth account nobody can tell apart.
Audience Audit: Is Each Network Worth Keeping?
Step one asked you to mark accounts keep, merge or close. Now you have the numbers to check that call. Start with where your audience is. Pew Research Center's 2026 fact sheet, published October 19, 2026 from a survey of 5,511 US adults, finds that 84% of US adults use YouTube, 70% use Facebook and about half use Instagram. Globally, DataReportal's Digital 2026 report counts 5.66 billion social media user identities, 68.7% of the world's population, with the typical internet user active on 6.75 platforms a month.
Those numbers say the audience is spread out, which is why most brands end up on several networks. They do not say you should be on all of them. For each account, ask three questions. Does our target customer use this network? Did this account produce interactions or traffic in the period? Can we post there at least weekly without hurting the others?
If the answer to the third question is no, close or pause the account and say so in a pinned post. A smaller set of active accounts beats a larger set of quiet ones. For app makers, our comparison of the best platforms for app promotion gives a starting view, and our social media statistics page has users per network if you need to justify the choice to someone else.
Newer networks deserve a fair look rather than a reflex. Threads and Bluesky are where many brands have started over; check Threads statistics and Bluesky statistics for current user numbers before deciding. Telegram channels behave differently again, with views per post as the main signal; our guide on how to grow a Telegram channel covers what to measure there.
Compliance Checks to Add to a Social Media Audit
A short compliance pass catches problems that are cheap to fix now and expensive later. Three checks cover most small brands.
First, paid partnerships. If creators or partners posted about you in exchange for money, free product or anything else of value, check that the posts were disclosed. Meta's branded content tools describe branded content as an organic post with a Paid partnership label that discloses the brand relationship. In the audit, list every partner post from the period and note whether the label or a clear written disclosure is there.
Second, other people's content. Reposted photos, user generated videos, music in Reels and screenshots of reviews all need permission or a license. Note any you cannot trace. Third, claims. Read the captions of your top posts for promises you cannot back up: fastest, number one, guaranteed. Those lines tend to survive in old posts long after anyone remembers writing them.
None of this needs a lawyer for a first pass. It needs someone to read the period's posts with these three questions in mind and add a line to the fix list for each problem.
Social Media Audit Example: A Filled In Template
A made up example for a small habit tracker app run by Alex, audited over 90 days. The numbers are invented to show how to fill in the template; they are not data from a real account.
| Field | Threads | |||
|---|---|---|---|---|
| Status | Keep | Keep | Keep | Close |
| Owner and admins | Alex (full control), one former freelancer still listed | Alex (Super admin) | Linked to Instagram | Unknown, made for a launch two years ago |
| Two factor on? | No | Yes | Follows Instagram | No |
| Bio and link check | Fix: link goes to the home page | Pass | Fix: empty bio | Fix: old logo, dead link |
| Followers start and end | 1,840 to 1,905 | 620 to 702 | 310 to 395 | 95 to 94 |
| Interactions | 1,120 | 860 | 540 | 6 |
| Reach or views | 24,300 reach | 11,200 impressions | 9,800 views | 410 impressions |
| Posts in period | 14, about 1 a week | 11, about 1 a week | 16, about 1.2 a week | 0 |
| Longest gap | 31 days | 24 days | 19 days | Whole period |
| Top post | Carousel: five habits in one week | Text post on the 2.0 release | Short tip with one screenshot | None |
| Visual score out of 14 | 7 | 9 | 6 | 2 |
| Visits from social | 38 product page views | 61 website sessions | 12 sessions | 0 |
Invented example. Note how the reach column says which measure each network reports; never add them together.
What the Example Audit Found and the Fix List It Produced
Read the example the way you would read your own. Four findings stand out, and none of them is about follower counts.
Access first. A former freelancer still has access to Instagram, and two factor authentication is off on the main account and on Pinterest. Those are the first two fixes, both done the same day. Nobody knows who controls Pinterest, and the account has not posted in the whole period, so it gets closed after its pins are exported.
Consistency second. Every kept account averages about one post a week, with gaps of three to four weeks. The gaps line up with the weeks Alex was shipping releases, which is exactly when the app had the most to say. That is the pattern we described in step six: the problem is capacity, not ideas.
Visuals third. Scores of 7, 9 and 6 out of 14 mean the feed does not look like one brand. In the example, the Instagram carousels use the app's colors but a different font from the LinkedIn posts, and the Threads posts use raw screenshots without a frame. The fix is one kit and one set of templates used everywhere.
Traffic last. The Instagram bio links to the home page, not the App Store, and no posts carry campaign links, so 38 product page views is a floor rather than the real number. Fixing the link and tagging posts by network makes next quarter's numbers usable.
The resulting fix list has eight lines: remove the freelancer, turn on two factor, export and close Pinterest, rewrite the Threads bio, point the Instagram link at the App Store with a campaign link, make a one page style guide, rebuild templates from it, and set a weekly posting rhythm of three posts per network with release posts planned in advance. The goals for next quarter are written in the same three numbers: followers, interactions and reach per network.
Social Media Auditing Tools: Free and Paid Options
You can run a full audit with native analytics and a spreadsheet. A tool saves time when you have several networks or audit every quarter. Prices are from each vendor's pricing page on October 28, 2026.
- 1
Spreadcast
Free to try, Pro $29 a monthBest when the audit says you need consistent, on brand posts on many networks
Spreadcast designs the post in your brand and publishes it for you, then shows followers and interactions per network and likes, comments, reach and views per post in one Analytics view, which covers most of step four without opening eleven apps.
It builds a brand kit from your App Store listing or website, so the fonts, colors, logo and screenshot frame the visual check looks for are the same on every post. It publishes to Instagram, Facebook, Threads, LinkedIn, Pinterest, TikTok, YouTube, Bluesky, Mastodon, Telegram and Discord. Through the Spreadcast MCP server, Claude or ChatGPT can read those analytics and draft the next posts in the same chat.
Free makes 3 posts to download with a small Spreadcast mark. Pro is $29 a month or $290 a year and includes clean posts with no cap, publishing to 10 social accounts across any mix of networks, autopilot or one tap approval and posting from Claude or ChatGPT. Studio is $79 a month for 5 apps and 50 accounts.
Pros
- Fixes visual drift at the source with one brand kit
- Posts to Telegram, Threads, Bluesky and Mastodon too
- Analytics per network and per post
Cons
- No competitor benchmarking
- Built first for App Store apps
- 2
Best for a first audit on a budget of zero
Meta Business Suite, LinkedIn Page analytics, YouTube Studio, Pinterest Analytics and TikTok Studio all report the three headline numbers for free. Copy them into the template above once a quarter.
The cost is time: about ten minutes per account to find the right tabs and copy the numbers, plus manual counting on Bluesky and Mastodon. History limits vary, so copy the numbers each quarter rather than relying on the platforms to keep them.
Pros
- Free and the most accurate source
- No extra logins to manage
Cons
- Different definitions on every network
- Slow with more than five accounts
- 3
Metricool
Free, Starter from $20 a month billed yearlyBest free plan for one brand with competitor tracking
Metricool's free plan covers one brand, 20 scheduled posts a month, 30 days of analytics history and analysis of five competitor profiles. PDF and PPT reports start on the paid plans.
Starter is listed at $20 a month billed yearly or $25 billed monthly for 5 brands.
Pros
- Competitor analysis on the free plan
- Reports on paid plans
Cons
- 30 days of history on free
- Does not design posts in your brand
- 4
Buffer
Free, Essentials from $5 per channel a monthBest for cheap reporting on a few channels
Buffer's free plan covers up to 3 channels with 10 scheduled posts each and 30 days of insights history. Essentials adds unlimited history and reports you can export as CSV or PDF.
Because Buffer prices per channel, the cost of a quarterly audit grows with every account you keep. See our list of Buffer alternatives if you run many networks.
Pros
- Simple, clear analytics
- Exportable reports from Essentials
Cons
- Priced per channel
- Free plan keeps only 30 days
- 5
Hootsuite
From $99 per user a month billed yearlyBest for teams that need benchmarking and scheduled reports
Hootsuite's Standard plan covers 10 social accounts with analytics and benchmarking against up to five competitors; Professional at $199 adds custom, scheduled and exported reports and benchmarking against 20 competitors. There is a 14 day free trial.
For a small brand the seat price is the obstacle. Our Hootsuite alternatives list compares cheaper options.
Pros
- Competitor benchmarking
- Scheduled report exports on Professional
Cons
- Priced per user
- Expensive for one person
- 6
Sprout Social
From $79 per seat a month billed yearlyBest for larger teams that want deep reporting
Sprout Social's Essentials plan is $79 per seat a month billed yearly or $99 billed monthly, with 5 social profiles and profile and post level reporting. Competitor reports are listed from the Professional plan at $299 per seat. There is a 30 day free trial.
Our Sprout Social alternatives page covers lighter options for small teams.
Pros
- Detailed reporting
- Long free trial
Cons
- Priced per seat
- Competitor reports only on higher plans
Social Media Audit Report Template: One Page
The audit report is what people actually read. Keep it to one page with these six blocks, in this order. Paste the template table underneath as an appendix for anyone who wants the detail.
| Block | What goes in it | Length |
|---|---|---|
| Scope | Accounts audited, the period, the date numbers were pulled and the engagement formula used | Two lines |
| Headline numbers | Followers, interactions and reach per kept network, with the change from last audit | One small table |
| Top findings | The three to five findings that matter most, in plain words | One line each |
| What worked | Top formats and topics from the content ranking, with one example link each | Three bullets |
| Fix list | Five to ten fixes, each with an owner and a due date | A short table |
| Goals and next audit | One goal per network in the three headline numbers, and the date of the next audit | Three lines |
If the report runs to a second page, cut findings, not fixes. Nobody acts on finding number eleven.
How Often to Do a Social Media Audit
Run a full social media audit once a quarter. That is often enough to catch drift and short enough that each audit has 90 days of data to work with. Between audits, a ten minute monthly check of the three headline numbers and posts per week is plenty.
Run an extra audit at three moments. When someone new takes over social, so they start from a clear baseline. Before a launch or a rebrand, so you know which accounts and templates need updating. And after any sudden drop in reach, where the access, Account Status and posting gap checks usually find the cause faster than anything else.
Keep each quarter on its own tab in the same sheet. By the third audit you will have a trend line per network, which is worth more than any external benchmark. It also makes the report easy to write: copy last quarter's tab, update the numbers, and the changes jump out.
If you report to a manager, an investor or a client, put the next audit date in the report itself. It turns the audit from a one off project into a routine. Our page on a startup marketing budget shows where the time for this sits next to everything else a small team pays for.
How to Do a Social Media Audit for a Client
Agencies and freelancers run the same ten steps with two changes. First, ask for access the right way. Request an Analyst role on LinkedIn, a Viewer role on YouTube and partner or basic access through the client's Meta business portfolio, rather than asking for passwords. Those roles let you see the numbers without the power to post or delete, and they are easy for the client to remove when the work ends.
Second, separate findings from recommendations. Clients take an audit more seriously when the first half is plainly factual (here is what we found, with dates and screenshots) and the second half is clearly your opinion (here is what we would change and why). Mixing the two makes every finding sound like a sales pitch.
Deliver the one page report first and the full template as an appendix. Walk the client through the access findings in person or on a call, because those sometimes involve former staff or partners and deserve a careful conversation.
If the client's main problem turns out to be capacity rather than strategy, say so. Our guide on whether to hire a social media manager compares the options with real prices, and the real cost of social media management shows what design time adds up to when every post is made by hand.
Common Social Media Audit Mistakes
Auditing different periods on different networks. Thirty days on Instagram and 90 on LinkedIn produce numbers you cannot compare. Pick one window and stick to it.
Adding reach, impressions and views together. They measure different things on different networks. Keep them in separate cells and label which one each network reports.
Comparing against the wrong benchmark. A reach based rate of 4% looks terrible next to a follower based benchmark of 0.30% only if you do not notice they use different formulas. They are not comparable at all.
Stopping at the numbers. A tab of figures with no fix list is not an audit; it is an export. If you only have time for half the steps, do steps one, two, six and ten.
Skipping the visual check. Analytics will never tell you that your feed uses three fonts. Readers notice anyway, and the inconsistency costs you trust on every post.
Auditing once. The value of an audit comes from the second and third, when you can see whether the fixes worked. Book the next one before you finish this one.
Where Spreadcast Fits: Fixing What the Audit Finds
Most audits of small brands end with the same three fixes: post more consistently, make the feed look like one brand, and cover more networks without more hours. Here is what that looks like before and after.
Before: you open Canva or Figma, find a template that is close, swap in a screenshot, adjust the colors to roughly match the last post, export a square, write a caption, then repeat the caption with small edits for LinkedIn, Threads and Bluesky, upload each one by hand, and forget Telegram entirely. Each post can take the better part of an hour, so it happens when there is a free hour, which is why the audit found four week gaps.
After: you paste your App Store link once at the start page. Spreadcast builds a brand kit from the listing, with your icon, colors and screenshots in an iPhone frame. When a new version ships or the app reaches a ratings milestone, it designs the post in that kit, writes a caption for each network within its limits and publishes to Instagram, Facebook, Threads, LinkedIn, Pinterest, TikTok, YouTube, Bluesky, Mastodon, Telegram and Discord, on autopilot or after one tap. For anything else, you type one line in Create or pick one of twelve post types for apps, and get a designed single image or carousel. You can also upload your own pictures and video to the same calendar.
The next audit then gets easier too. Analytics shows followers and interactions per network and likes, comments, reach and views per post in one place, so step four takes minutes. If you work in Claude or ChatGPT, the Spreadcast MCP server lets the assistant read those numbers and draft the next week's posts for your approval. The full feature list is on the features page, and the pricing page shows what each plan includes, from a $19 Post Pack to Pro at $29 a month.
Spreadcast will not do the access check, the competitor review or the compliance pass for you. Those stay with you. What it removes is the reason most audits find the same gaps quarter after quarter: nobody had time to design the post.
Frequently Asked Questions
What is a social media audit?
A social media audit is a structured review of every social account a brand owns: who has access, what each profile says, how the numbers moved over a fixed period, which posts worked, how often you posted and whether the feed looks consistent. It ends with a short list of fixes and goals.
How do you do a social media audit step by step?
List every account, check access and two factor authentication, review each profile, pull followers, interactions and reach for one period, rank your posts, count posting gaps, score visual consistency, check traffic from social, compare three competitors and write a fix list with owners and dates.
What should a social media audit include?
At minimum: an account inventory, an access list, a profile check, the three headline numbers per network, top and bottom posts, posting frequency and the longest gap, a visual consistency score, traffic from social and a one page report with fixes and goals.
How long does a social media audit take?
For a brand with about five accounts, two to four hours the first time and about an hour once the template exists. Larger companies with many accounts and teams usually need one to two days, mostly for the access check and the competitor review.
How often should you do a social media audit?
Once a quarter, plus an extra audit when someone new takes over social, before a launch or rebrand, and after a sudden drop in reach. A ten minute monthly check of followers, interactions, reach and posts per week fills the gaps between audits.
Is there a free social media audit tool?
The native analytics in Meta Business Suite, LinkedIn, YouTube Studio, Pinterest and TikTok are free and the most accurate source. Copy their numbers into a spreadsheet template like the one on this page. Free plans from scheduling tools usually keep only about 30 days of history.
What is the difference between a social media audit and a social media report?
A report shows how the numbers moved over a period. An audit also checks accounts, access, profiles, consistency and traffic setup, and ends with fixes. Most teams report monthly and audit quarterly, using the audit to decide what the reports should track.
What is a good engagement rate for a social media audit?
It depends on the formula. Buffer's 2026 study puts median rates by reach at about 5.5% on Instagram and 6.2% on LinkedIn, while Rival IQ's follower based medians are 0.30% on Instagram and 2.01% on TikTok. Compare only against a benchmark that uses your formula.
Can I use ChatGPT or Claude for a social media audit?
Yes, for the analysis. Paste your template or exported numbers and ask it to rank posts, spot gaps and draft the report. It cannot see your private analytics unless you connect a tool that provides them, so check its numbers against the source.
Where These Facts Come From
Every outside number, rule and price on this page links to the page it was taken from.
- Check your Account Status on InstagramInstagram Help Center
- About Instagram insightsInstagram Help Center
- Securing your Meta account with two factor authenticationInstagram Help Center
- Edit the alternative text for a post on InstagramInstagram Help Center
- Review and export a copy of your Instagram informationInstagram Help Center
- Add people to a business portfolio and assign a business assetMeta Business Help Center
- Branded content and the Paid partnership labelMeta for Creators
- Threads Insights APIMeta for Developers
- Instagram allows up to five links in bio, April 18, 2023TechCrunch
- LinkedIn Page analyticsLinkedIn Help
- LinkedIn Page admin rolesLinkedIn Help
- Get started with YouTube AnalyticsYouTube Help
- Add or remove access to your YouTube channel with channel permissionsYouTube Help
- Review Pinterest AnalyticsPinterest Business Help
- Setting up your profile, including link verificationMastodon documentation
- How to verify your Bluesky account with a domain, April 28, 2023Bluesky
- Channel statisticsTelegram API documentation
- URL builders: collect campaign data with custom URLsGoogle Analytics Help
- Default channel groupGoogle Analytics Help
- Campaign links in App Store Connect AnalyticsApple Developer
- Understanding Success Criterion 1.4.3, Contrast (Minimum)W3C
- Americans' use of social media in 2026, October 19, 2026Pew Research Center
- Digital 2026 Global Overview ReportDataReportal
- 2026 social media industry benchmark report, March 5, 2026Quid (Rival IQ)
- The state of social media engagement in 2026, March 5, 2026Buffer
- Metricool pricingMetricool
- Hootsuite plans and pricingHootsuite
- Sprout Social pricingSprout Social
- Buffer pricingBuffer
- Analytics in the YouTube appYouTube Creators on YouTube
- Web accessibility perspectives: colors with good contrastW3C Web Accessibility Initiative on YouTube
- Checking color contrast for accessibility in FigmaFigma on YouTube
Researched and written by Spreadcast. Last checked on October 28, 2026.