What Are Social Media KPIs?
Social media KPIs (key performance indicators) are the handful of numbers you agree, in advance, will tell you whether your social media is doing its job. A metric is anything a network counts: likes, views, saves, profile taps. A KPI is a metric you have picked on purpose, tied to a goal, given a target and a date, and that you will act on when it moves. Every KPI is a metric. Most metrics are not KPIs.
That difference matters because the native dashboards show dozens of numbers and almost all of them go up and down for reasons you cannot control. Meta's reference for Instagram alone lists nine metrics for a single post and another set for the account, and every other network has its own list, often with a different name for the same idea. If you try to watch all of them you end up watching none. The point of choosing social media KPIs is to shrink that wall of numbers down to a few you can explain to someone else in one sentence each.
So when people search for a KPI for social media marketing, what they usually need is not a longer list. They need a short list that matches what they are trying to get from social in the first place: people who know the brand, people who interact with it, people who click through, people who sign up or install, and customers who get answers. This page gives you 20 candidates grouped by those goals. Pick three to six of them, not all 20.
One rule runs through the whole guide. Followers, interactions and reach are the headline numbers. They are the three that every network reports, that anyone can understand, and that tell you whether an account is growing, whether people care about what it posts, and how many people actually saw it. Everything else on this page is there to explain why those three moved, or to connect them to money.
Key Takeaways
Lead With Three Numbers
Followers (and how many you gained), interactions and reach. Put them at the top of every report, per network, with the change since last period beside each one.
Pick KPIs by Goal
Awareness, engagement, traffic, conversion and customer care each have their own KPIs. Choose the goal first, then two or three KPIs that prove it moved.
Every Network Counts Differently
Instagram replaced impressions with views for media created after July 2, 2024, per Meta's documentation. LinkedIn counts a video view after 2 seconds. Compare a network with itself over time, not with another network.
Clicks Need UTM Links
Native analytics stop at the click. To see visits and signups from social in Google Analytics, tag links with utm_source, utm_medium and utm_campaign, as Google's URL builder help describes.
Most Teams Stop at Engagement
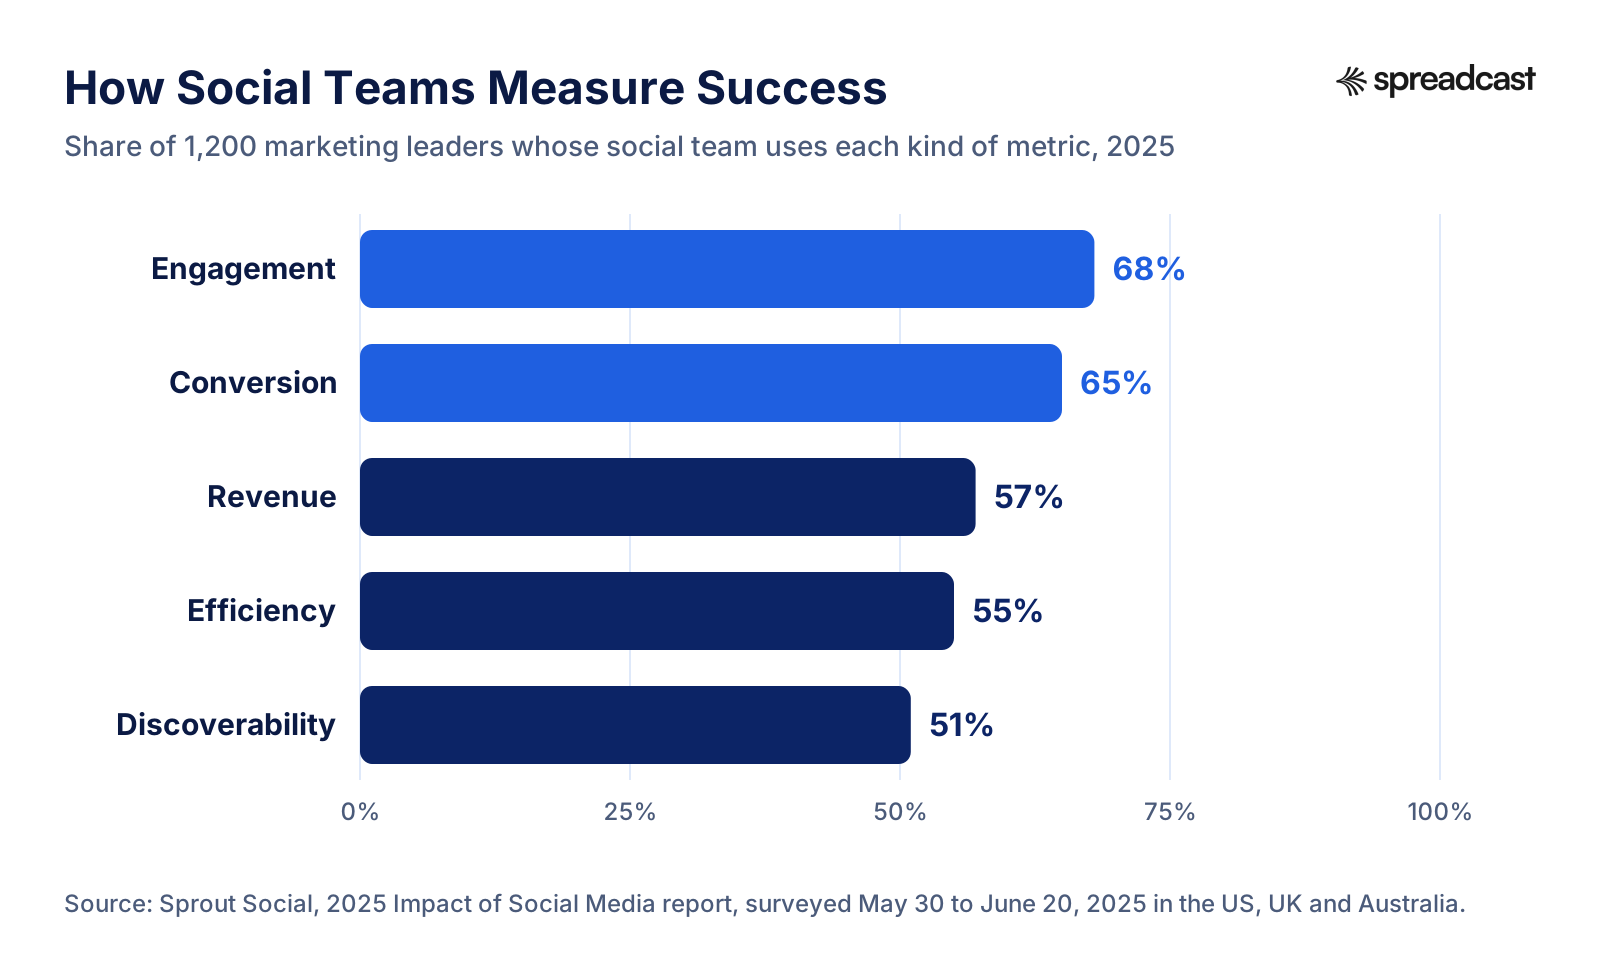
68% of social teams measure success by engagement and 65% by conversion, per Sprout Social's 2025 survey of 1,200 marketing leaders. Only 44% of leaders rate their team as expert at measuring business impact.
Consistency Is a KPI Too
Posts published divided by posts planned is the KPI small teams skip and the one that moves all the others. An account that posts half its plan cannot judge any other number fairly.
How We Researched This
We wrote this page on October 28, 2026. For every KPI, we went to the platform's own documentation to see what it actually counts, rather than repeating definitions from tool vendors that often lag behind platform changes. That meant Meta's developer reference for Instagram media insights, Instagram account insights, Threads insights and Facebook Page insights; LinkedIn's help pages on post analytics, video analytics and follower analytics; YouTube's impressions and click through rate FAQ and the YouTube Analytics API metrics list; Pinterest's analytics help; the TikTok video object in TikTok's developer docs; Mastodon's Status entity; and Telegram's channel statistics schema.
For traffic and conversion KPIs we used Google's own help on campaign URLs, the default channel group and key events, plus Apple's App Store Connect help on campaign links and App Store metrics. For what marketing teams actually track, we used Sprout Social's 2025 press release and Chief Marketer's write up of the same survey. For benchmarks we used the 2026 Rival IQ benchmark report, now published by Quid, and Buffer's 2026 engagement study. Each source is linked where it is used and listed at the bottom of the page.
The formulas are standard arithmetic, written out so you can paste them into a spreadsheet. The worked examples use a made up account, a small habit tracker app run by Alex, so you can see the maths with round numbers. They are illustrations, not benchmarks. Where a real benchmark exists, we name the study and the date, and we say how its denominator differs from yours, because that one detail explains most of the disagreement between published numbers.
Social Media KPIs vs Metrics: What Is the Difference?
A metric is a count or a rate the platform hands you. A KPI is a metric with four extra things attached: a goal it serves, a baseline (where it is today), a target (where you want it by a date), and an owner who will do something when it misses. Without those four, a number is just information. With them, it becomes a decision you have already half made.
Here is the test we use. Ask of any number: if this went down by a third next month, would we change what we post, where we post or how often? If the honest answer is no, it is a metric worth glancing at, not a KPI. Saves on a LinkedIn post, for example, are interesting but rarely change a plan. Followers gained on the network you are betting on, on the other hand, should change the plan quickly if they stall.
This is also why the same KPI list does not fit every account. A local bakery cares about reach in its city and direct messages asking about orders. An app founder cares about product page visits and installs. A B2B SaaS team cares about clicks to a demo page. A creator cares about followers and watch time. All four can share the headline trio of followers, interactions and reach, then branch into different KPIs below it.
If you have never written KPIs before, start by auditing what you have. Our social media audit template walks through pulling a baseline from each account, which is the first number every KPI needs. Without a baseline, a target is a guess.
Social Media KPIs Grouped by Goal
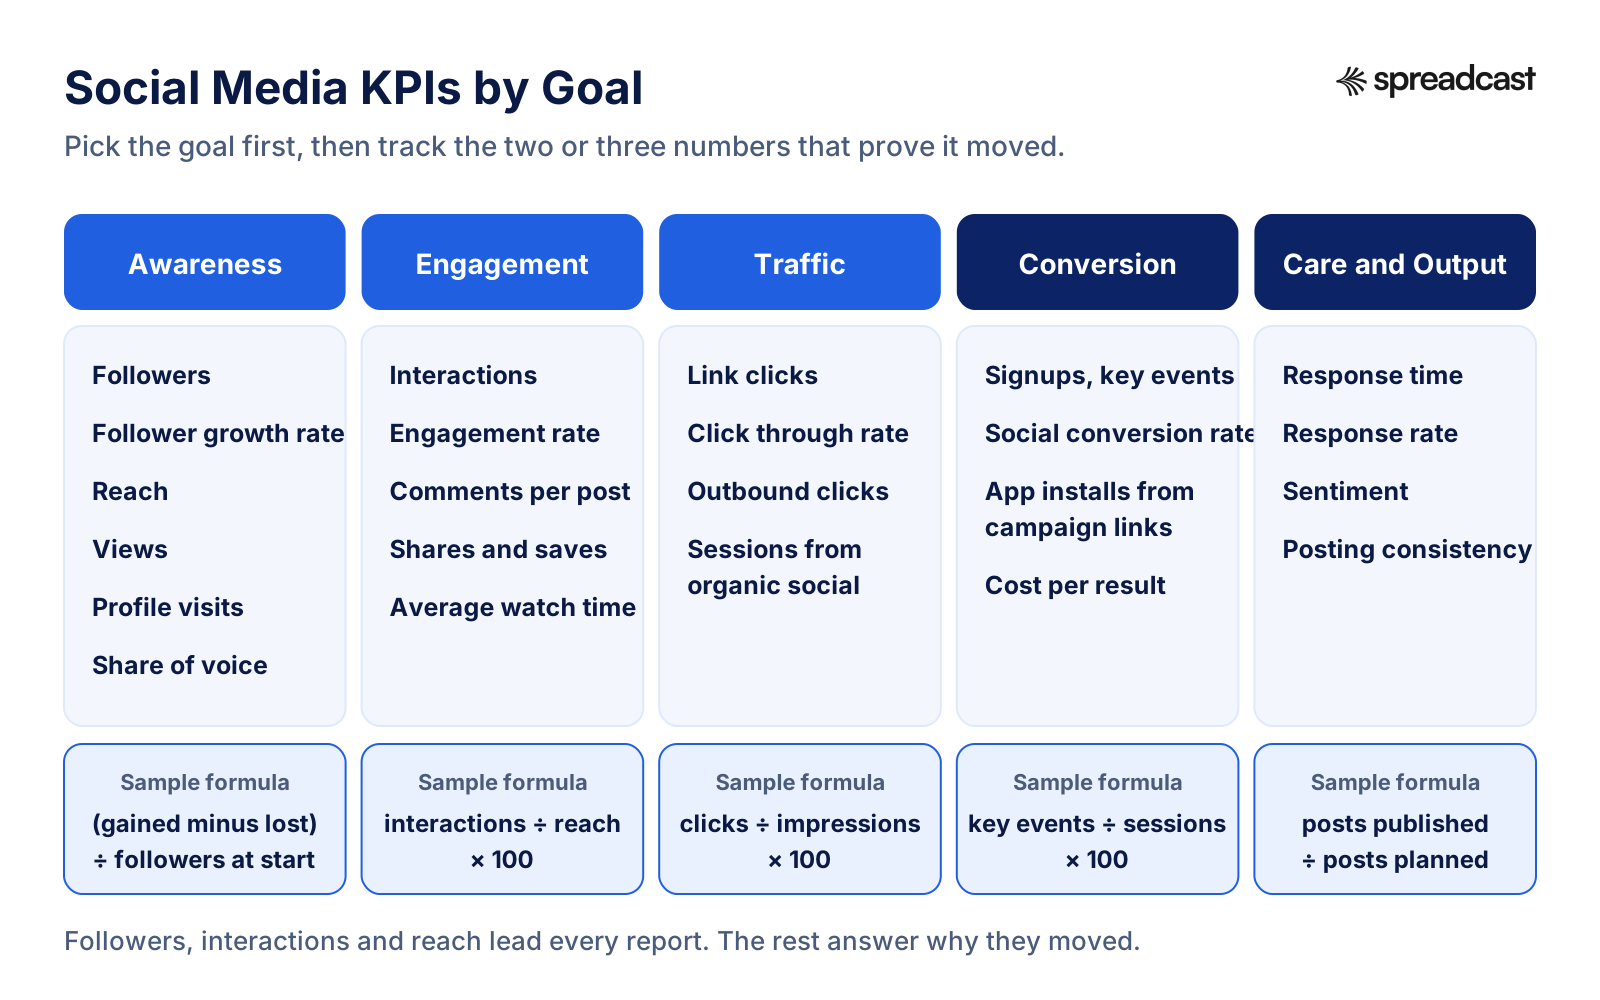
The 20 KPIs on this page sorted into five goals. Most accounts need one column fully and the headline trio from the first two.
The Three Headline KPIs: Followers, Interactions and Reach
If you only track three social media KPIs, track these. They work on every network, they are easy to explain to a founder or a client, and together they answer the three questions anyone asks about an account: is it growing, do people care, and how many people saw it.
Followers comes first because it is the one number that compounds. Each follower is someone the network will try to show your next post to. On its own, a total is a vanity number; tracked as followers gained and lost per period it becomes a real KPI. Instagram's account insights expose this directly as follows and unfollows, Threads reports followers_count, and LinkedIn's follower analytics show new followers over time and update the total once a day.
Interactions comes second. It is the count of things people did with a post: likes, comments, shares, saves, reposts, replies, quotes. Meta defines Instagram's total interactions as likes, saves, comments and shares, minus unlikes, unsaves and deleted comments. Interactions is better as a headline than engagement rate because it does not depend on which denominator you chose, and it adds up cleanly across networks.
Reach comes third. It is the number of unique accounts that saw a post at least once. Meta's documentation calls Instagram reach an estimated count that does not include repeat views by the same account; LinkedIn's equivalent is members reached, defined as distinct members and pages who viewed a post with repeat views not counted. Reach tells you the size of the audience you actually got, which is the denominator for most of the rates further down.
Put these three at the top of every report, per network, with the change since the last period beside each. A month where followers rose, interactions held and reach fell tells a very different story from one where all three fell together, and you can read it in ten seconds.
Tip: if you post with Spreadcast, its Analytics tab already leads with these numbers. It opens on followers (total, gained and growth), then interactions, with followers by network beside the chart, and lists likes, comments, reach and views for the posts it published, wherever the network reports them. You see the headline trio without exporting anything. See what Analytics shows.
20 Social Media KPIs to Track, With Formulas
Every KPI on this page in one table. The example column uses Alex's made up app account so the arithmetic is easy to check; replace the numbers with your own.
| KPI | Goal | Formula | Example |
|---|---|---|---|
| 1. Followers gained | Awareness | followers at end minus followers at start | 1,240 minus 1,100 = 140 net new followers this month |
| 2. Follower growth rate | Awareness | (followers gained minus followers lost) ÷ followers at start × 100 | (170 minus 30) ÷ 1,100 × 100 = 12.7% |
| 3. Reach | Awareness | unique accounts that saw a post (from the network) | Average reach of 820 per post across 12 posts |
| 4. Views or impressions | Awareness | times content was displayed or played (from the network) | 14,600 views in the month |
| 5. Profile visits | Awareness | profile visits ÷ reach × 100 | 310 visits ÷ 9,800 reach × 100 = 3.2% |
| 6. Share of voice | Awareness | your mentions ÷ (your mentions + competitor mentions) × 100 | 45 ÷ (45 + 255) × 100 = 15% |
| 7. Interactions | Engagement | likes + comments + shares + saves (+ reposts, replies, quotes) | 640 + 52 + 38 + 70 = 800 |
| 8. Engagement rate | Engagement | interactions ÷ reach × 100 (or ÷ followers) | 800 ÷ 9,800 × 100 = 8.2% by reach |
| 9. Comments per post | Engagement | comments ÷ posts published | 52 ÷ 12 = 4.3 |
| 10. Share and save rate | Engagement | (shares + saves) ÷ reach × 100 | (38 + 70) ÷ 9,800 × 100 = 1.1% |
| 11. Average watch time | Engagement | total watch time ÷ views | 2,100 minutes ÷ 6,000 views = 21 seconds |
| 12. Link clicks | Traffic | clicks on links you shared (from the network or your link tool) | 190 clicks in the month |
| 13. Click through rate | Traffic | clicks ÷ impressions × 100 | 190 ÷ 14,600 × 100 = 1.3% |
| 14. Sessions from organic social | Traffic | sessions in the Organic Social channel (Google Analytics) | 260 sessions |
| 15. Social conversion rate | Conversion | key events from social ÷ sessions from social × 100 | 13 signups ÷ 260 × 100 = 5% |
| 16. App installs from social | Conversion | first time downloads attributed to your social campaign links | 41 first time downloads |
| 17. Response time | Care | median time from message to first reply | 3 hours 10 minutes |
| 18. Response rate | Care | messages answered ÷ messages that needed a reply × 100 | 47 ÷ 50 × 100 = 94% |
| 19. Sentiment | Care | positive mentions ÷ (positive + negative mentions) × 100 | 36 ÷ (36 + 4) × 100 = 90% |
| 20. Posting consistency | Output | posts published ÷ posts planned × 100 | 12 ÷ 16 × 100 = 75% |
Engagement rate is covered in one row here on purpose. For every variant (by followers, reach, impressions and views) and the 2026 benchmarks per network, use our engagement rate calculator.
Social Media KPIs for Brand Awareness
Awareness KPIs answer one question: are more of the right people seeing us than last month? They sit at the top of the funnel, so they move first and fastest when you post more often or try a new format, and they are where most young accounts should start.
Followers and follower growth rate (KPIs 1 and 2) are the backbone. Use growth rate rather than raw gains when you compare periods or accounts of different sizes. Gaining 140 followers is a strong month at 1,100 and a quiet one at 50,000. Count losses too: Instagram's follows_and_unfollows metric splits the two, but note that Meta does not return follower metrics for accounts with fewer than 100 followers, so very new accounts have to read the number off the profile and keep their own log.
Reach (KPI 3) is the best single awareness number because it counts people, not displays. Views (KPI 4) counts every time something was shown or played, so one person scrolling past a post twice counts twice. On Instagram, views now replaces impressions: Meta deprecated the impressions metric for media created after July 2, 2024, and describes views as the number of times a post was played or displayed, a metric it still labels as in development. Facebook follows the same pattern with page_media_view, the number of times content was played or displayed, beside a separate count of unique viewers.
Profile visits (KPI 5) is underrated. A post that sends people to your profile is doing awareness work that likes do not show: those visitors are reading your bio and deciding whether to follow. Instagram reports profile_visits per post, and Threads reports views of your profile at the account level. Dividing visits by reach gives you a profile visit rate you can compare across posts.
Share of voice (KPI 6) is the one awareness KPI the networks do not hand you. It compares how often your brand is mentioned with how often named competitors are, over the same period. Most small teams count it by hand once a quarter with a saved search on each network. It is worth the effort only if you are in a crowded category where buyers compare a few names.
Which of these are social media KPIs for brand awareness that a small team should actually track? Reach and follower growth rate, per network, monthly. Add profile visits on Instagram if you post there, because it is the clearest signal that a post made people curious. If you are building awareness across many networks at once, our social media statistics page shows where the audiences are in 2026, and the Threads and Bluesky pages cover the two newer networks in detail.
Engagement KPIs: Interactions, Engagement Rate and Watch Time
Engagement KPIs tell you whether the people who saw a post did anything about it. They are the fastest feedback on creative: a weak post shows up here within a day.
7. Interactions
The sum of every action on a post. Each network counts a different set: Threads reports likes, replies, reposts, quotes and shares; LinkedIn counts reactions, comments, saves, sends and reposts; Mastodon exposes favourites, boosts, replies and quotes. Add the ones your network gives you and keep the recipe the same every month.
8. Engagement Rate
Interactions divided by reach (or by followers), times 100. It lets you compare posts and periods of different sizes. Pick one denominator and never mix them: a rate by reach usually reads many times higher than a rate by followers for the same post. Our engagement rate calculator does every variant and lists 2026 benchmarks per network.
9. Comments per Post
Comments divided by posts published. Comments take more effort than a like and usually signal that a post started a conversation or raised a question. Track it as a number per post, not a rate, because comment counts on small accounts are low and a percentage makes them look noisy.
10. Share and Save Rate
Shares plus saves, divided by reach. These are the two interactions that say a post was useful enough to pass on or come back to. Pinterest builds this in: its save rate is total saves divided by the number of times your Pins were on screen.
11. Average Watch Time
For video, total watch time divided by views. YouTube's Analytics API reports averageViewDuration as the average length, in seconds, of video playbacks. LinkedIn reports average watch time per video and counts a view only after 2 seconds of watching.
Which to Pick
Interactions is the headline. Add engagement rate when you need to compare posts, comments per post if conversation is the goal, and watch time only if video is a real part of your plan. Three engagement KPIs is plenty.
What Counts as a Good Engagement Number
Benchmarks help you sanity check, not set targets. The trouble is that published studies use different denominators. The 2026 Rival IQ report, published March 5, 2026, divides interactions by followers and puts the all industry median engagement rate per post at 0.30% on Instagram and 2.01% on TikTok. Buffer's 2026 study divides by reach instead and reports 2025 medians of about 5.5% on Instagram and 4.6% on TikTok. Both can be right; they are measuring different things.
So the practical rule is this: decide your denominator, then compare yourself with yourself. A KPI target such as "raise engagement rate by reach from 6% to 7% on Instagram this quarter" is far more useful than "beat the industry average", because you control the formula and the data on both sides.
One more nuance from Buffer's data: on Bluesky it does not publish a rate at all and reports interactions per post instead, a median of about 4 likes, comments and reposts combined. That is a fair way to track any small or new network where reach is not reported. If you want the full table of rates per network and per follower tier, the engagement rate calculator page keeps it current.
Traffic KPIs: Clicks, Click Through Rate and Sessions
Traffic KPIs measure whether social sends people somewhere you own: a website, a landing page, an App Store product page. This is where the native dashboards start to run out.
12. Link Clicks
Clicks on the links in your posts, bio or stories. Threads reports clicks per link you shared; Pinterest reports outbound clicks, the number of times people take an action that leads them to a destination off Pinterest, and counts them only from the date the link was added to the Pin.
13. Click Through Rate
Clicks divided by impressions, times 100. On YouTube the equivalent is impressions click through rate, how often viewers watched after seeing a thumbnail; YouTube says half of all channels and videos sit between 2% and 10%. Pinterest's outbound click rate is the same idea for Pins.
14. Sessions From Organic Social
Visits that start from a social network, as Google Analytics sees them. GA4 puts traffic in its Organic Social channel when the source matches a known social site or the medium is a value such as social or social media. Tagging links with UTM parameters keeps those visits from landing in Direct or Referral.
Why the Numbers Disagree
The network counts a click when someone taps. Google Analytics counts a session only when the page loads and its tag fires. Expect sessions to be lower than clicks, sometimes by a lot on mobile, and track both rather than forcing them to match.
Conversion KPIs: Signups, Installs and Cost per Result
Conversion KPIs connect social to the outcome the business is paid for. They take the most setup and give the most credibility in a report.
15. Social Conversion Rate
Key events from social divided by sessions from social, times 100. In GA4 a key event is any event you mark as important, such as a signup or a purchase; standard properties can mark up to 30, and marking is not retroactive, per Google's key events help. Mark the event before the campaign, not after.
16. App Installs From Social
For an iPhone app, add an App Store campaign link with a provider token and a campaign token to each post. App Store Connect then reports impressions, product page views and first time downloads per campaign, once a campaign has at least five first time downloads.
17. Cost per Result
What you spent divided by the result you wanted: cost per follower, per click, per signup or per install. For organic social the cost is mostly time, so price your hours honestly. It is the number that tells you whether to keep doing something by hand.
Revenue From Social
If you sell online, GA4 can attribute purchases to the Organic Social channel. Treat it as a floor, not the full number: people often see a post, then come back later by typing your name, and that visit is not credited to social.
Community and Customer Care KPIs
These KPIs measure how well you show up when people talk to you. They matter most for brands that get questions, complaints or orders through social.
18. Response Time
The median time from a comment or message arriving to your first reply. Use the median, not the average, so one weekend message does not distort a month. Sprout Social reports that most consumers want brands to respond within 24 hours or sooner.
19. Response Rate
Messages and comments you answered, divided by those that needed an answer, times 100. Decide what needs an answer up front (questions, complaints, order requests) so the denominator does not shift every month.
20. Sentiment
Positive mentions divided by positive plus negative mentions, times 100, leaving neutral ones out. Small accounts can tag each mention by hand in a spreadsheet; tools do it automatically but still miss sarcasm. Read the negative ones yourself.
Posting Consistency
Posts published divided by posts planned. It is listed with output KPIs in the table, but it belongs here in spirit: an account that goes silent for two weeks teaches its followers to stop looking for it.
Posting Consistency: The Social Media KPI Small Teams Skip
Most KPI lists leave out the one number that sits underneath all the others: did you actually post what you planned? It sounds too basic to be a KPI. In practice it is the first thing to break on a small team, and when it breaks every other KPI becomes unreadable. If reach fell in a month where you posted six times instead of sixteen, you have learned nothing about your content and everything about your calendar.
Track it weekly as posts published divided by posts planned, per network. Anything under 80% for two weeks running is a signal to cut the plan or change how the posts get made, not to try harder. A plan you hit at 100% with three posts a week beats a plan of daily posts you hit at 40%, because the first one gives you clean data and a steady presence.
The usual reason consistency fails is not ideas, it is production. Each post needs a design in the right size for each network, a caption that fits each network's limits and someone to schedule it. Our guides on batching a month of content in one afternoon and what to post when you run out of ideas cover the planning side, and how to automate social media posts covers the tools.
This is the gap Spreadcast is built for. Today you might design each post in a design tool, resize it for Instagram, LinkedIn and Pinterest, write three captions and schedule them one by one. With Spreadcast you write one line or pick a post type, it designs the post in your brand and writes a caption for each network, and it publishes to Instagram, Facebook, Threads, LinkedIn, Pinterest, TikTok, YouTube, Bluesky, Mastodon, Telegram and Discord on your schedule. For apps it goes further and posts on its own when a new version ships or the app hits a ratings milestone. Pro is $29 a month for 10 connected accounts with no cap on posts. See the plans.
What Each Network Reports: Native Analytics Compared
The headline trio exists on every network, but under different names and with different rules. This is what each one gives you natively, checked against the platform's own documentation on October 28, 2026.
| Network | Audience numbers | Post numbers | Rules worth knowing |
|---|---|---|---|
| Followers, follows and unfollows, reach, accounts engaged | Views, reach, likes, comments, saves, shares, total interactions, profile visits | Impressions deprecated for media created after July 2, 2024. Follower metrics need 100 or more followers. Data can be delayed up to 48 hours, per Meta. | |
| Follows, unique viewers | Views (page_media_view), unique media viewers, post engagements | Page Insights need 100 or more likes and keep the last two years, per Meta's Page Insights reference. | |
| Threads | Followers, profile views, follower demographics | Views, likes, replies, reposts, quotes, shares, link clicks | Demographics need at least 100 followers. Insights cannot be queried before April 13, 2024, per Meta's Threads docs. |
| Followers, new followers over time | Impressions, members reached, reactions, comments, saves, sends, reposts, video views | Impressions are an estimate. Post analytics cover the past 7 to 365 days, per LinkedIn Help. | |
| Total audience, engaged audience | Impressions, saves, Pin clicks, outbound clicks, engagements, engagement rate | Custom ranges cover the past year and a half; the last 48 hours are estimates, per Pinterest Help. | |
| TikTok | Followers | Views, likes, comments, shares | The developer API exposes view_count, like_count, comment_count and share_count per video, per TikTok for Developers. |
| YouTube | Subscribers gained and lost | Views, impressions, impressions click through rate, watch time, average view duration, likes, comments, shares | Impressions on external sites and end screens are not counted, per YouTube Help. |
| Bluesky | Followers | Likes, reposts, replies, quotes shown on each post | No reach or views to divide by; Buffer tracks interactions per post instead of a rate. |
| Mastodon | Followers | Favourites, boosts, replies, quotes | The Status entity has no views or impressions count, per Mastodon's docs. |
| Telegram | Followers, share with notifications on, growth over time | Views per post, shares per post, reactions per post, views by source | All defined in the channel statistics schema, compared with the previous period of equal length. |
| Discord | Server members | Reactions and replies on announcement posts | Treat member count and replies as your trio; there is no per post reach to divide by. |
Names and rules change often. Instagram and Threads both label views as in development in their documentation, so expect small revisions to past numbers.
Why the Same KPI Gives Different Numbers on Each Network
If you have ever added up "impressions" across five networks and felt uneasy, you were right to. The word means something slightly different on each one, and a few of the differences are big enough to change a decision.
Start with views and impressions. Instagram now reports views as every time a post was played or displayed, and Meta's own reference marks it as in development. LinkedIn defines impressions as the number of times a post was displayed on screen and adds that the number is an estimate and may not be precise. A LinkedIn video only counts as a video view after 2 seconds of watching. YouTube counts an impression only for a registered thumbnail view on YouTube itself and leaves out external websites and end screens. Adding these together gives you a number that looks precise and means nothing.
Reach has a similar problem. Instagram reach and LinkedIn members reached both count unique viewers, but each network deduplicates only within itself, so the same person who saw your post on both is counted twice in any total. Mastodon and Bluesky do not report reach to you at all. Telegram reports average views per post rather than unique reach, which is closer to a views number than a reach number.
Thresholds and delays add a third layer. Meta withholds follower metrics on Instagram below 100 followers, Facebook Page Insights need 100 likes, and Threads demographics need 100 followers. Instagram account data can be delayed up to 48 hours, and Pinterest marks the last 48 hours as estimates that may go down. If you pull numbers on the first of the month, the last two days of the previous month are often still moving.
The fix is not a perfect formula. It is three habits. Compare each network with itself over time rather than with other networks. Pull monthly numbers three days after the month ends, not on day one. And when you do total across networks, total interactions and followers gained, which are counts of real actions, rather than impressions or views.
Video: Where the Numbers Live in YouTube Studio
YouTube's own walkthrough of the Analytics page shows the Overview, Reach, Engagement and Audience tabs. Reach holds impressions and click through rate; Engagement holds watch time and average view duration, two of the KPIs above.

Which Social Media KPIs Marketing Leaders Use
What larger teams report on, from a 2025 survey of 1,200 marketing leaders. Engagement and conversion lead; revenue and efficiency follow.
What the Survey Data Says About Social Media KPIs
The most useful public data on which KPIs teams actually use comes from Sprout Social's 2025 Impact of Social Media survey. According to Sprout's press release, Glimpse surveyed 1,200 marketing leaders in the US, UK and Australia between May 30 and June 20, 2025. Most social teams measure success by engagement (68%) and conversion rates (65%). Chief Marketer's coverage of the same report adds revenue at 57%, efficiency at 55% and discoverability at 51%.
Two things stand out. First, engagement still leads, which matches what we see: it is the easiest number to get and the first one the dashboards show. Second, almost two thirds of teams already try to measure conversion, which means the reporting bar has moved past likes. If you report to a boss, an investor or a client, expect to be asked what social sent to the website or the App Store.
The same release says only 44% of leaders rate their social team as expert at measuring business impact, and that leaders often put this down to a lack of sophisticated reporting. Our reading: most teams do not lack a tool so much as the setup work, tagged links, marked key events and campaign links, that turns clicks into something a report can count. The next three sections cover exactly that setup.
The survey also shows why leaders care. Respondents credit social with customer acquisition (60%), customer loyalty (58%) and revenue (56%). Those are business words, not social words. A KPI report that ends at reach and interactions leaves the people paying for social to guess the connection; one that adds clicks, signups or installs makes it for them. If you are putting a budget around this, our guide to a startup marketing budget shows where the social line sits.
How to Track Clicks and Signups From Social With UTM Links
Native analytics end at the tap. To follow a visitor from a post to a signup, you need the link itself to carry its origin. That is what UTM parameters do. Google's URL builder help lists the ones that matter: utm_source for the referrer (instagram, linkedin), utm_medium for the channel (social), and utm_campaign for the product, promotion or launch. It also lists utm_content, which is handy for telling apart two links in the same post.
A tagged link for Alex's app looks like this in practice: the landing page address, then ?utm_source=instagram&utm_medium=social&utm_campaign=october_update. Use one source value per network and keep them lowercase. Google's help recommends one unique utm_source for each distinct platform, and warns that missing parameters show up as (not set) in reports.
The medium value decides which channel the visit lands in. GA4's default channel group puts a visit in Organic Social when the source matches its list of social sites or the medium is one of a fixed set of values, including social, social network and social media. Paid Social needs a social source plus a paid medium such as cpc or paid. If you write utm_medium=insta or utm_medium=post, the visit falls out of both social channels and your social numbers look smaller than they are.
Then mark what counts as a result. In GA4 you identify or create the event (a signup, a trial start, a purchase) and mark it as a key event. Google's help is clear that marking applies from the time you create the mark and does not change historic data, and that standard reports can take up to 24 hours to show the change. So mark key events before a campaign starts.
Once both pieces are in place, three KPIs from the table come free: sessions from organic social (KPI 14), key events from social, and social conversion rate (KPI 15). Open the Traffic acquisition report, filter to the Organic Social channel and add your key event as a column. That is the conversion slide of your monthly report.
Video: Google's Guide to the Acquisition Reports
Google Analytics explains the difference between the User acquisition report (how new users found you) and the Traffic acquisition report (how every session began). The second one is where your Organic Social sessions and UTM campaigns show up.

How to Track App Installs From Social Media
If the business is an iPhone app, the conversion that matters happens on the App Store, not on your website, and Google Analytics cannot see it. Apple's answer is campaign links. A campaign link is your App Store URL with a provider token (pt), which identifies your developer account and stays the same, and a campaign token (ct), which you change for each campaign. Apple allows up to 30 characters for the campaign token.
When someone taps the link and lands on your product page, App Store Connect attributes impressions, product page views, first time downloads, usage, sales and subscriptions to that campaign. A download counts if it happens within 24 hours of using the link, and if a person taps several campaign links, the most recent one gets credit for later sales. Campaigns appear only after 24 hours and once they have first time downloads from at least five people, and each metric shows only once it reaches five in the selected range, so small campaigns can look empty for a while.
The KPI to track is first time downloads per campaign (KPI 16), with a campaign token per network or per post type: instagram_update, linkedin_launch, threads_tips. Then compare it with product page views from the same campaign. Apple's App Store metrics reference defines conversion rate as total downloads and preorders divided by unique device impressions, which is the store side of the same funnel.
Building those links by hand is fiddly, so we made a free App Store campaign link generator that builds them in bulk. For what a normal product page converts at, see App Store conversion rate benchmarks, and for what paid installs cost you to compare against, cost per install benchmarks. Once installs are flowing, the LTV to CAC ratio tells you what each one is worth.
Spreadcast was built first for this case. Paste your App Store link at Spreadcast's start page and it builds a brand kit from the listing, then watches the listing every day; when a new version goes live or the app reaches a ratings milestone, it designs the post with your real screenshots in an iPhone frame, writes a caption per network and publishes it, on full autopilot or after one tap of approval. Each release becomes a post with a link back to the product page, so the install KPI has something to count every time you ship.
Video: Key Events and Conversions in Google Analytics
Google explains why conversions were renamed key events in Google Analytics and how they relate to conversions in Google Ads. Watch it before you mark the signup or purchase event your social conversion rate depends on.

How to Set Social Media KPIs in Six Steps
The same process works for a solo founder and a team of ten. Budget about an hour for the first pass.
- Step 1
Name One Business Goal for Social
Write it as a sentence a non marketer would understand: more people know the app exists, more trial signups, fewer unanswered customer questions. One primary goal per quarter. A second is fine if it is clearly secondary.
- Step 2
Choose Two or Three KPIs Under the Goal
Use the goal columns above. For awareness: reach and follower growth rate. For signups: sessions from organic social and social conversion rate. For an app: first time downloads from campaign links. Always keep followers, interactions and reach at the top as well.
- Step 3
Pull a Baseline From the Last 90 Days
Use each network's own analytics and write down the monthly average for every KPI you chose. Three months smooths out one viral post or one quiet holiday week. If an account is new, your baseline is the first full month of posting.
- Step 4
Set a Target and a Date
Base the target on the baseline and on what you will change, not on an industry average. If you are going from 8 to 16 posts a month, a 30% lift in reach is reasonable; if nothing changes, expect nothing to change.
- Step 5
Give Every KPI an Owner and a Cadence
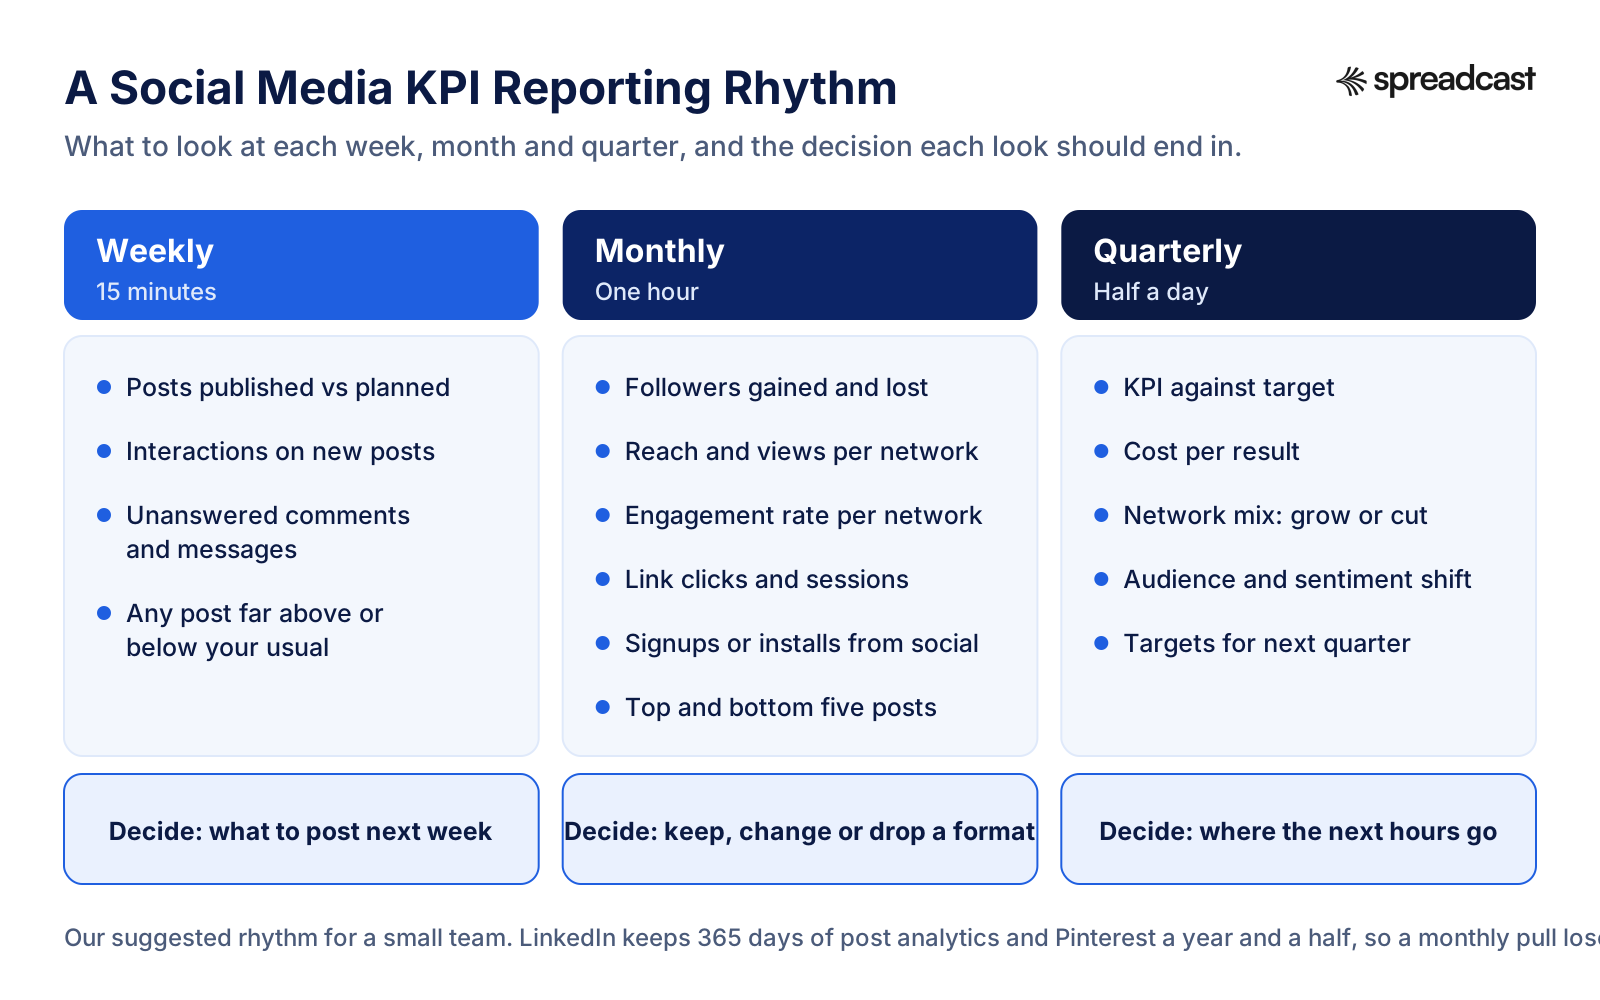
One person checks it, at a set rhythm, and knows what they will do if it misses. On a solo team the owner is you, and the cadence below keeps it to about 15 minutes a week.
- Step 6
Review, Then Change One Thing
At each monthly review, keep what worked, cut one thing that did not and try one new thing. Changing five things at once means you cannot tell which one moved the number.
Social Media KPI Tracker Template
Copy this into a spreadsheet, one tab per month. The filled row shows Alex's made up example so you can see how each column is used; the rest are ready for your numbers.
| KPI | Network | Formula | Baseline | Target | This Month | Change | Owner |
|---|---|---|---|---|---|---|---|
| Followers gained | end minus start | 95 a month | 150 a month by March | 140 | Up 47% | Alex | |
| Follower growth rate | Each network | (gained minus lost) ÷ start × 100 | Your 90 day average | Your target | This month | vs baseline | Name |
| Reach per post | Each network | network figure, averaged | Your 90 day average | Your target | This month | vs baseline | Name |
| Interactions | Each network | likes + comments + shares + saves | Your 90 day average | Your target | This month | vs baseline | Name |
| Engagement rate by reach | Each network | interactions ÷ reach × 100 | Your 90 day average | Your target | This month | vs baseline | Name |
| Link clicks | Each network | network or link tool figure | Your 90 day average | Your target | This month | vs baseline | Name |
| Sessions from organic social | Google Analytics | Organic Social channel | Your 90 day average | Your target | This month | vs baseline | Name |
| Social conversion rate | Google Analytics | key events ÷ sessions × 100 | Your 90 day average | Your target | This month | vs baseline | Name |
| First time downloads | App Store Connect | per campaign token | Your 90 day average | Your target | This month | vs baseline | Name |
| Response time | All inboxes | median minutes to first reply | Your 90 day median | Your target | This month | vs baseline | Name |
| Posting consistency | Each network | published ÷ planned × 100 | Your 90 day average | 90% or more | This month | vs baseline | Name |
Keep one row per KPI per network rather than one blended total; the totals hide which network moved.
How Often to Report on Social Media KPIs
A simple rhythm that keeps reporting small: a quick weekly check, a monthly report and a quarterly reset. Each one ends in a decision.
Social Media KPI Report Template: What to Put on One Page
A good social media KPI report fits on one page and can be read in two minutes. Anyone who wants more can open the tracker. We put five blocks on it, in this order.
First, the headline trio per network: followers (with gained and lost), interactions and reach, each with the change against last month and against target. Use plain arrows or words, not colour alone. This block answers "are we growing" before anyone asks.
Second, the goal KPIs: the two or three you picked for this quarter's goal. If the goal is signups, this is sessions from organic social, signups and social conversion rate. If the goal is installs, it is first time downloads by campaign and the product page views behind them. One line each on why it moved.
Third, the top and bottom posts of the month, three to five of each, with a thumbnail, the network, reach and interactions. This is the part people actually read, because it turns numbers into examples. Write one sentence on what the best ones had in common: a format, a topic, a hook.
Fourth, output: posts published against plan, response time and response rate. Keep it short. It is there so that a dip in reach in a month where you posted half your plan is read correctly.
Last, one decision for next month. Not a list of learnings, one change: post carousels on LinkedIn twice a week, move the Tuesday post to Thursday, drop Pinterest and add Threads. A report that ends in a decision gets read again next month to see if the decision worked. For carousel and image sizes per network when you act on it, keep our social media image sizes and character limits handy.
Social Media KPI Dashboard: Native Tools, a Spreadsheet or One Place
There are three ways to build a social media KPI dashboard, and the right one depends on how many networks you post to and how much time you will give it.
Native analytics only. Free and the most accurate, because the numbers come straight from the network. The cost is time: with five networks you open five dashboards, each with its own date picker, names and delays. This works for one or two networks and a monthly report.
A spreadsheet fed by hand. Still free, and it gives you the tracker above with your own formulas and history that does not disappear when a network changes its dashboard. Most small teams should start here. Budget about an hour a month to copy the numbers in, three days after month end so the late data has settled. Google Sheets or Excel both work; a chart per KPI per network is enough.
One place that pulls the numbers for you. Social media tools read the same platform APIs described in this guide and chart them together. The trade off is cost and the fact that a tool can only show what the API exposes, which is why tools sometimes lose a metric when a platform deprecates it, as happened when Meta retired impressions on Instagram.
If you already publish through Spreadcast, the third option comes with the posting. Its Analytics tab leads with followers per network and interactions, adds an engagement rate, and lists likes, comments, reach and views for each post it published, wherever the network reports them. If you work in Claude or ChatGPT, the Spreadcast MCP server can read the same analytics, so you can ask for last month's numbers in a chat and get the headline trio back without opening a dashboard.
Social Media KPIs Examples by Business Type
The headline trio stays the same. The goal KPIs underneath change with the business. These are our picks for six common cases.
Mobile App
Reach and follower growth on the two networks your users are on, plus first time downloads from App Store campaign links. Our guide on how to promote an app on social media covers which networks those usually are, and how to get app downloads covers every other source.
SaaS or B2B
LinkedIn reach and follower growth, link clicks, sessions from organic social and trial or demo signups as a key event. Comments per post matters on LinkedIn more than elsewhere, because comments carry a post further in the feed.
Online Shop
Reach, saves and shares on Instagram and Pinterest, outbound clicks, and purchases from the Organic Social channel in Google Analytics. Pinterest's outbound click rate is a strong leading signal for product pages.
Local Business
Reach, profile visits and direct messages asking about bookings or orders, plus response time. A café does not need a conversion funnel; it needs to know people nearby saw the post and that every message got a reply the same day.
Creator or Personal Brand
Follower growth rate, watch time on video and shares. Shares are how creators reach new people, and follower growth rate tells you whether those new people stayed.
Agency Reporting to Clients
The headline trio per network for every client, the client's goal KPI and output against the agreed plan. Clients read the trio and the top posts. Keep every client on the same template so you can compare accounts.
Vanity Metrics and Other KPI Mistakes to Avoid
A vanity metric is a number that looks good and changes nothing. Total followers on its own is the classic example, which is why this page tracks followers gained and growth rate instead. Raw impressions and views are the other common one. They are fine as context but too easy to inflate with a single lucky post, and they mean different things on every network.
Mixing denominators is the mistake we see most often in reports. Engagement rate by followers one month and by reach the next can look like a tenfold jump that never happened. Write the formula into the tracker and never change it mid year. If you must change it, restate the past months with the new formula so the line stays comparable.
Reporting totals across networks hides the network that matters. A combined reach number that rose 20% can hide a 30% fall on the one network where your customers are. Keep a row per network, then total interactions and followers gained if you need a single number.
Setting targets from someone else's benchmark is the next trap. A median from a study of large brands tells you little about an account with 800 followers that posts twice a week. Benchmarks are for a sanity check; your baseline is for targets.
Last, tracking too many KPIs. Twenty KPIs is a menu, not a dashboard. Teams that track everything usually act on nothing, because every month something went up and something went down. Three to six is the range that gets read.
If your KPIs keep pointing at weak creative rather than weak timing, the fix is upstream of analytics. Our guides on what makes a social media post work and keeping a brand consistent without a designer cover the design side of the numbers.
Where Spreadcast Fits: How to Hit Your Social Media KPIs Without a Designer
Most social media KPIs move for one boring reason: the account posts good looking, on brand content often enough, on the networks where its audience is. The KPI work above tells you whether that is happening. Spreadcast is for the part that usually stops it from happening, which is making and publishing the posts.
The before looks like this. A founder or a one person marketing team decides to post four times a week on Instagram, LinkedIn and Threads. Each post means opening a design tool, finding the brand colours and fonts, placing a screenshot, exporting three sizes, writing three captions that fit three limits and scheduling each one. Two weeks in, a release slips or a customer issue comes up, and the plan drops to one post a week. Posting consistency falls to 25%, reach follows it down, and the monthly report shows a decline nobody can explain from the numbers alone.
Now the after. You paste your App Store link, or your website, or a short description of the brand, at the start page, and Spreadcast builds a brand kit with your icon, colours and screenshots. You write one line in Create, or pick one of twelve post types for apps such as a testimonial, a how to or a feature, and it designs a single image post or a carousel in your brand, writes a caption per network and puts it on the calendar. You approve it, or let autopilot publish. For an app, new versions and ratings milestones turn into posts without you starting anything.
Then the KPIs read themselves. Analytics shows followers and interactions per network and likes, comments, reach and views per post, so the headline trio and the top posts of the month are already there when you write the report. If you prefer to work in Claude or ChatGPT, the same actions (design a post, write captions, schedule, approve, read analytics) are available through the MCP server.
What it costs: Free makes 3 posts to download with a small Spreadcast mark and no publishing, enough to see the design quality. Pro is $29 a month or $290 a year with clean posts, no cap, publishing to 10 social accounts across any mix of networks, autopilot or one tap approval, and posting from Claude or ChatGPT. Studio is $79 a month for 5 apps and 50 accounts, each with its own brand. If you would rather not subscribe, a Post Pack is $19 once for 10 posts designed and published, and a 30 Day Pass is $39 once for everything in Pro for 30 days. Paid plans have a 7 day full refund. For comparison with hiring help, our guide on what a social media manager costs prices the other options. Start with your App Store link or website.
Frequently Asked Questions
What are social media KPIs?
Social media KPIs are the few metrics you choose in advance to judge whether social media is meeting a goal, each with a baseline, a target, a date and an owner. Common ones are followers gained, reach, interactions, engagement rate, link clicks, signups or installs from social, and response time.
What is KPI in social media marketing?
KPI stands for key performance indicator. In social media marketing it is a metric tied to a business goal, such as reach for awareness or sessions from organic social for traffic, that you track at a set rhythm and act on when it misses its target.
What are the most important social media KPIs?
Followers (tracked as followers gained or growth rate), interactions and reach. They exist on every network, they are easy to explain, and they tell you whether the account is growing, whether people care and how many saw the posts. Add one or two goal KPIs, such as clicks or installs, underneath.
What are KPIs for brand awareness on social media?
Reach, follower growth rate, views and profile visits are the main ones, plus share of voice if you compete with a few named brands. For most small accounts, reach and follower growth rate per network, checked monthly, are enough.
How do you measure social media KPIs?
Take audience and post numbers from each network's own analytics, track clicks and signups in Google Analytics with UTM tagged links and key events, and track app installs with App Store campaign links. Record them monthly in a tracker with one row per KPI per network.
What is the difference between reach and impressions?
Reach counts unique accounts that saw a post at least once. Impressions, now called views on Instagram and Facebook, count every time the post was displayed or played, so one person can count several times. Impressions are always equal to or higher than reach.
How often should you report on social media KPIs?
A short weekly check of posting against plan and unanswered messages, a monthly report on followers, reach, interactions and goal KPIs, and a quarterly review against targets. Pull monthly numbers about three days after the month ends, because some networks keep revising the last 48 hours.
Is follower count a vanity metric?
Total followers on its own can be, because it only goes up slowly and says little about this month. Followers gained, followers lost and follower growth rate are real KPIs, because they show whether the account is getting stronger and react quickly when posting stops.
What should a social media KPI report include?
The headline trio per network with change against last month and target, the goal KPIs for the quarter, the top and bottom posts with a sentence on why, output against plan, and one decision for next month. One page is enough.
Where These Facts Come From
Every outside number, rule and price on this page links to the page it was taken from.
- Instagram media insights: reach, views, total interactions and the impressions deprecationMeta for Developers
- Instagram account insights: follows and unfollows, reach, views, thresholds and delaysMeta for Developers
- Threads insights: media and user metrics and limitsMeta for Developers
- Facebook Page insights: views, unique viewers, follows and data limitsMeta for Developers
- Combined post analytics: impressions, members reached and engagementsLinkedIn Help
- Video analytics: video views, watch time and average watch timeLinkedIn Help
- Follower analytics for your LinkedIn PageLinkedIn Help
- Impressions and click through rate FAQYouTube Help
- YouTube Analytics and Reporting APIs: metricsGoogle for Developers
- Pinterest analytics: impressions, saves, outbound clicks and engagement ratePinterest Help
- Video object: view, like, comment and share countsTikTok for Developers
- Status entity: favourites, boosts, replies and quotes countsMastodon documentation
- Channel statistics: stats.broadcastStatsTelegram
- URL builders: collect campaign data with custom URLsGoogle Analytics Help
- Default channel group: Organic Social and Paid Social rulesGoogle Analytics Help
- Mark events as key eventsGoogle Analytics Help
- Campaign links: provider and campaign tokens and thresholdsApple Developer
- App Store Connect performance metrics: impressions, product page views and conversion rateApple Developer
- 2026 social media industry benchmark report, March 5, 2026Quid (Rival IQ)
- The state of social media engagement in 2026Buffer
- Social media wins the budget war, August 20, 2025Sprout Social
- Marketers are looking beyond top of funnel when gauging social media effectiveness, September 9, 2025Chief Marketer
- Social media response timeSprout Social
- Analytics in YouTube StudioYouTube Creators on YouTube
- Find where users are coming from using Acquisition Reports in Google AnalyticsGoogle Analytics on YouTube
- Key Events and Conversions in Google AnalyticsGoogle Analytics on YouTube
Researched and written by Spreadcast. Last checked on October 28, 2026.