App Store Conversion Rate: What the Number Actually Measures
Your App Store conversion rate tells you how often people who see your app go on to download it. That sounds like one number. In practice there are at least four, and the published benchmarks you find in search mix them freely. Apple's own console divides total downloads by unique impressions. Most App Store Optimization tools divide first time downloads by product page views. Google Play Console stopped showing a conversion rate in 2026 and now reports a click through rate on install buttons. Apple Ads reports a tap through install rate on ads. Each is a fair number. None of them can be compared with another.
That is why one blog tells you the average App Store conversion rate is 25% and another says 8.56%, and why a founder who opens App Store Connect and sees 4% wonders whether the product page is broken. Most of the time it is not. The number on the screen and the number in the blog post are answers to different questions.
This page puts the definitions first, then the benchmarks. You get Apple's exact formula from its developer help pages, Google's from the Play Console help center, the full category tables from AppTweak's 2025 data for both stores, a side by side of the published averages with the reason each one differs, and a list of changes that move the number, each tied to what Apple or Google say the change does. If you only need one sentence: compare your rate with Apple's private peer group benchmarks in App Store Connect first, because they use the same formula as your dashboard and no public benchmark does.
If you came here from our guide on how to get app downloads, this is the long version of its short answer to what a good App Store conversion rate is. The broader context, such as how many people visit the store each week and how many apps compete for them, is in our App Store statistics reference.
How We Researched This
On October 28, 2026 we opened every source on this page and read the figures from the page itself. For definitions we used only first party documentation: Apple's App Store Connect metric definitions, its acquisition source types, its peer group benchmarks help page and its App Analytics overview, and Google's Play Console help page on store listing performance. Where a vendor blog described a definition differently from Apple or Google, we went with the platform.
The category numbers come from AppTweak's average conversion rate per category, published May 18, 2026 with 2025 data for the United States. The article text names only the top and bottom categories. The full lists sit in three embedded charts, and we read every value from the chart data, which AppTweak last edited on May 4, 2026. We also compared AppTweak's figures with Adapty's conversion rate benchmarks, updated January 2, 2026, which quote AppTweak data from the first half of 2024, and with AppFollow's 2026 benchmarks article, which uses its own August 2026 data and a different set of denominators.
Three rules apply throughout. Every figure names who measured it, what was divided by what, and the period. Anything we calculated is marked as derived, with the arithmetic shown. Examples with made up numbers use an app owned by Alex, a fictional developer, and say so. We did not use paywalled reports or figures that we could not trace to a named publisher.
App Store Conversion Rate Benchmarks at a Glance
The numbers people search for most, with the definition next to each one. Read the third column before the second: it decides what the figure can be compared with.
| Benchmark | Figure | What is divided by what | Who measured it and when |
|---|---|---|---|
| Average App Store conversion rate | 8.56% | First time downloads ÷ product page views | AppTweak, United States, 2025 |
| Average Google Play conversion rate | 16.15% | Downloads ÷ store listing views | AppTweak, United States, 2025 |
| Average App Store install rate | 3.8% | First time downloads ÷ impressions in search and browse results | AppTweak, United States, 2025 |
| Highest App Store category | 52.8% (Food & Drink) | First time downloads ÷ product page views | AppTweak, United States, 2025 |
| Lowest App Store category | 5.2% (Games: Trivia) | First time downloads ÷ product page views | AppTweak, United States, 2025 |
| Highest Google Play category | 62.3% (Auto & Vehicles) | Downloads ÷ store listing views | AppTweak, United States, 2025 |
| Lowest Google Play category | 6.6% (Games: Strategy) | Downloads ÷ store listing views | AppTweak, United States, 2025 |
| Average on default product pages | 1.6% | Not spelled out on the page. Apple's console formula is downloads ÷ unique impressions | Apple, custom product pages overview, undated |
| Lift from sending people to a custom product page | 2.5 percentage points on average | Same as the row above | Apple, custom product pages overview, undated |
| Apple Ads at the top of search results | Over 60% | Installs ÷ taps on the ad | Apple Ads, all Apple Ads countries and regions, November 2024 to October 2025 |
| Older App Store average still quoted widely | 25% | Downloads ÷ page views | Adapty citing AppTweak, United States, first half of 2024 |
| App Store search installs, category medians | 2.6% (Games) to 12.4% (Food & Drink) | Installs ÷ unique device impressions from search | AppFollow, United States, August 2026 |
All sources were opened on October 28, 2026. Apple does not publish an average for App Store Connect's own conversion rate: the only comparison it offers on that formula is the private peer group benchmark inside your account.
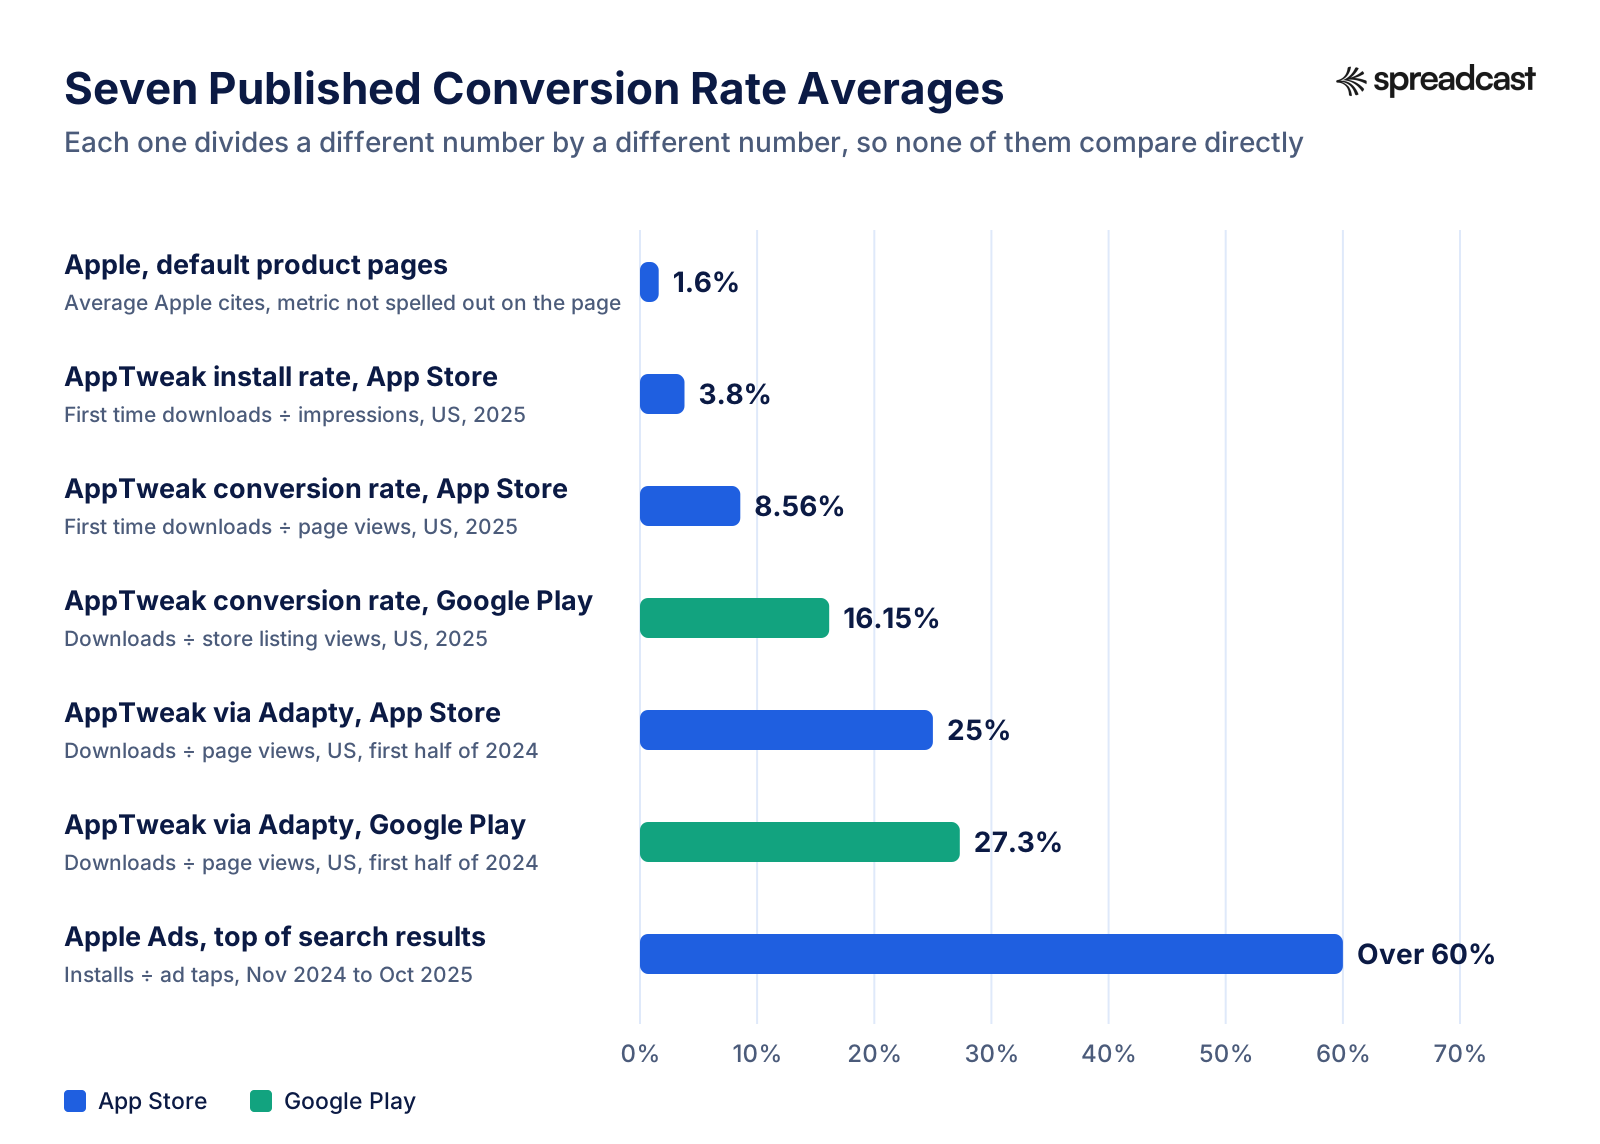
Average App Store Conversion Rate: Seven Published Numbers Side by Side
Drawn on one axis, the published averages run from 1.6% to over 60%. The spread is almost entirely a matter of definition, not of how good apps are at converting.
How App Store Connect Calculates Conversion Rate
Apple's definition is short. In the metric definitions for App Store Connect Analytics, conversion rate is total downloads and pre orders divided by unique device impressions. A pre order counts toward the rate when it is placed and is not counted a second time when the app later downloads to the device. Every word in that sentence matters, so here is each part in turn.
Total downloads is the sum of first time downloads and redownloads. A first time download is counted on a device running iOS, macOS, tvOS or visionOS. A redownload is counted when a customer taps the redownload button, and Apple excludes automatic updates and device restores. So a person who deleted your app last year and installs it again today raises your conversion rate exactly as much as a new customer does.
Unique device impressions is the number of unique devices that viewed your app on the Today, Games, Apps or Search tabs of the App Store. An impression requires the app to be on screen for more than one second, and impressions include product page views. Apple's analytics overview describes unique impressions as the number of people who view your app icon on the App Store in a given day, and gives a worked example: 100 unique impressions and 50 total downloads on a day make a 50% conversion rate.
Two consequences follow. First, the denominator is far wider than a page view. Your app scrolling past in a search result for one second counts, even if the person never taps it. That is why Apple's rate usually looks low next to the numbers on ASO blogs, which divide by page views. Second, the numerator includes returning users. Apple's 2025 Transparency Report counts 929,754,061 average weekly downloads against 2,053,461,208 average weekly redownloads across the store, so redownloads are not a rounding error. Derived: 2.21 redownloads for every first time download (2,053,461,208 ÷ 929,754,061). An app with a large lapsed audience can post a strong conversion rate with very few new users.
Apple also sets a floor before the number appears at all. App Store metrics, conversion rate among them, become available once your app has at least five first time downloads or pre orders. Usage metrics such as sessions rely on people who opted in to share analytics with developers, but conversion rate is built from App Store data, not from that opt in group.
If you have opened the App Analytics page recently you will also see a new metric with conversion in its name: day 35 download to paid conversion, the share of first time downloads or redownloads followed by an In App Purchase within 35 days. That one measures monetization, not the product page. Keep the two apart when someone asks for your conversion rate.
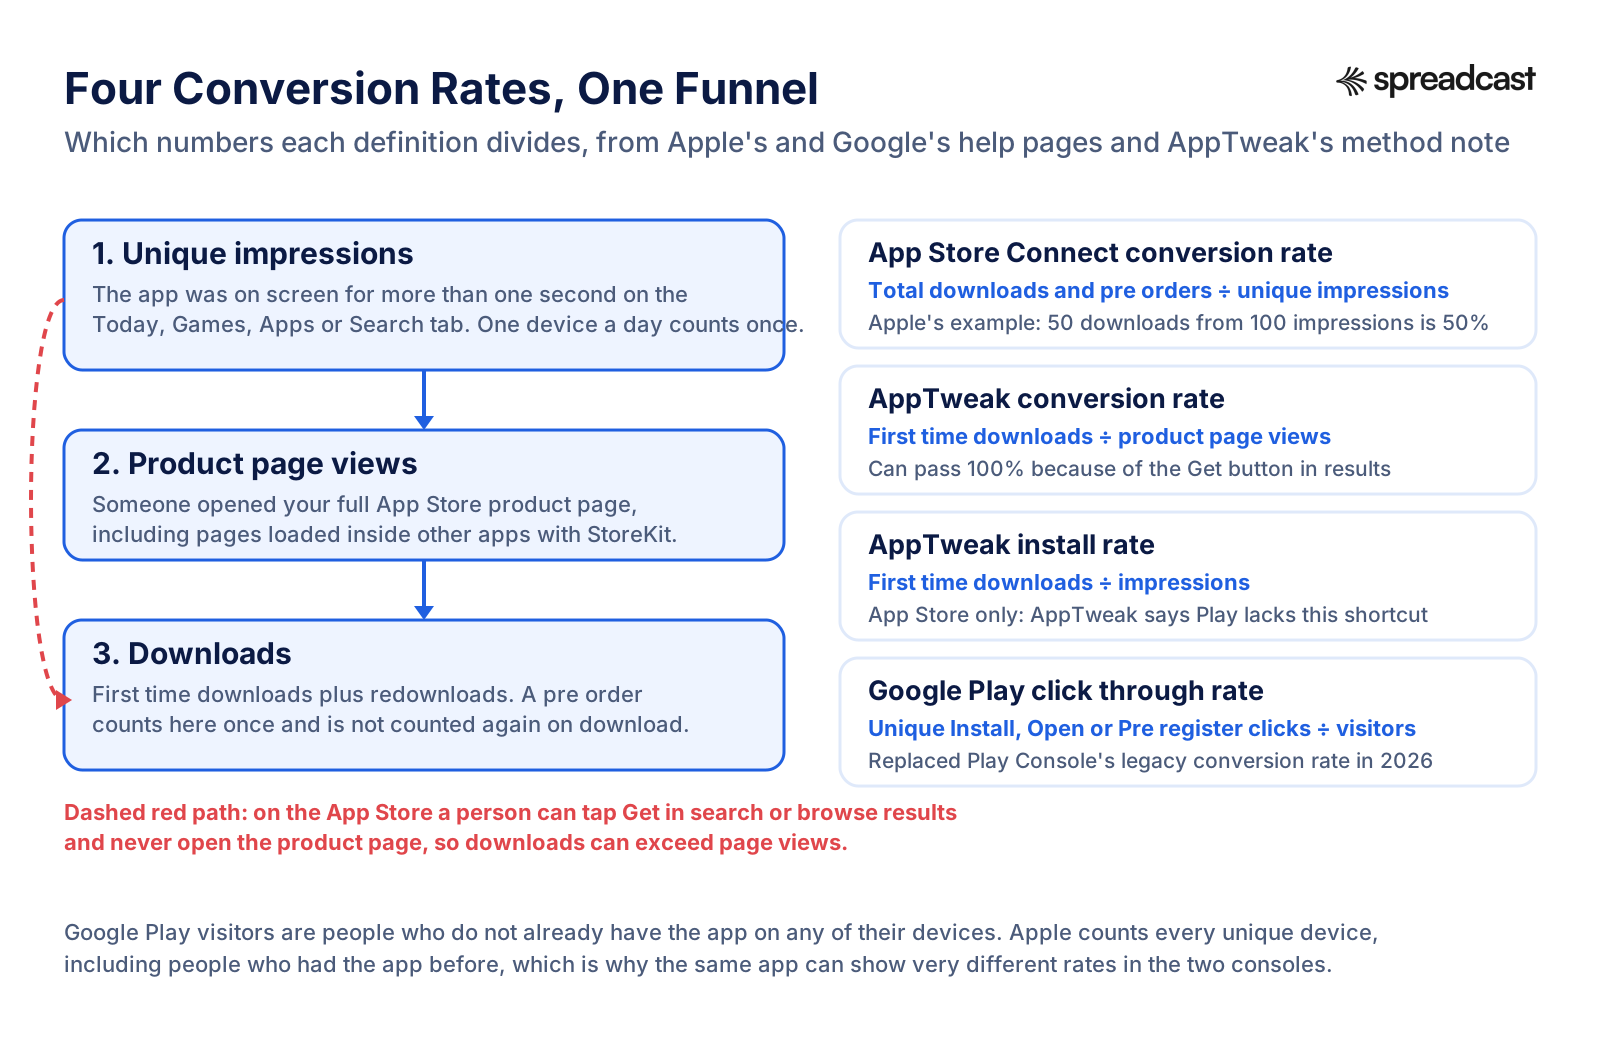
Where Each App Conversion Rate Sits in the Store Funnel
The four definitions in use, mapped onto the three steps a person goes through. The red path is the reason App Store page view rates can pass 100%.
App Store Connect Conversion Rate: Every Metric That Feeds It
The definitions below are quoted closely from Apple's help pages, with our note on what each one means for the rate you see. If a number in your dashboard looks wrong, check it against this table first.
| Metric in App Store Connect | Apple's definition | What it means for your conversion rate |
|---|---|---|
| Impressions | Times your app was viewed on the Today, Games, Apps and Search tabs for more than one second, including product page views | The raw count. Conversion rate does not use it, because one person scrolling past twice would count twice. |
| Impressions (unique devices) | Unique devices that viewed your app on those tabs, including unique product page views | The denominator. A featuring slot or a broad search term can lift it sharply and pull your rate down on the same day. |
| Product page views | Times your product page was viewed, including pages loaded inside other apps with StoreKit | Not in Apple's formula. It is the denominator most ASO tools use instead. |
| First time downloads | First downloads on devices with iOS, macOS, tvOS or visionOS | Part of the numerator. The only download type AppTweak counts in its averages. |
| Redownloads | Taps on the redownload button, excluding automatic updates and device restores | Also part of the numerator. A win back campaign raises your rate without adding a new user. |
| Total downloads | First time downloads plus redownloads | The numerator Apple uses, together with pre orders. |
| Pre orders | Pre orders placed, minus cancelations | Counted toward the rate when placed and not counted again at download. |
| Conversion rate | Total downloads and pre orders ÷ unique device impressions | Available once you have five first time downloads or pre orders. |
| Day 35 download to paid conversion | Share of first time downloads or redownloads followed by an In App Purchase within 35 days | A monetization rate shown in peer group benchmarks. Not a product page metric. |
Sources: metric definitions and peer group benchmarks, App Store Connect Help, read October 28, 2026.
How to Find Your App Store Connect Conversion Rate
The steps below follow Apple's help pages. Menu names can shift between App Store Connect releases, so if a label differs, look for the same idea one level up.
- Step 1
Open Analytics for Your App
Sign in to App Store Connect, open your app and choose the Analytics tab. Apple's campaign links help page describes the path that matters here: Metrics in the sidebar, then filters on top of the chart.
- Step 2
Pick Conversion Rate and a Date Range
Choose conversion rate as the metric and read at least 28 days. A single week is noisy for a small app, and Apple only shows the metric once you have five first time downloads or pre orders in the range.
- Step 3
Break It Down by Source Type
Apple's analytics overview suggests viewing conversion by source type to see which sources convert best. App Store Search, App Store Browse, App Referrer and Web Referrer usually behave very differently, so an average of all four hides most of what you need to know.
- Step 4
Add a Campaign or Product Page Filter
If you share tagged links, filter by campaign. If you run custom product pages, filter by product page to compare each custom page with the default one.
- Step 5
Compare With Your Peer Group
Open the peer group benchmarks and read where you sit against the 25th, 50th and 75th percentile for your category and business model. Apple's help page explains that you can switch to all categories or narrow the group by download volume.
- Step 6
Write Down the Number Before You Change Anything
Record the rate by source type, the date range and the peer percentile in a note. Every test you run later is judged against this baseline, and the dashboard will not remember what it looked like before your new screenshots went live.
App Store Conversion Rate by Source Type
Where the visitor came from changes the rate more than almost anything on the page. Apple's acquisition help page defines the source types. The ranges in the last column come from AppFollow's August 2026 data for the United States App Store, and note that AppFollow divides by different things for different rows.
| Source type | Apple's definition | Published range (category medians) |
|---|---|---|
| App Store Search | People viewed or downloaded your app from search, including ads in search results | 2.6% (Games) to 12.4% (Food & Drink), installs ÷ unique device impressions |
| App Store Browse | People viewed or tapped to download while browsing, for example in Today, Games or Apps | 0.1% to 2.5%, installs ÷ unique device impressions |
| App Referrer | People tapped a link in another app, including StoreKit and Apple apps such as Messages, but not Safari | 4.5% to 53.0%, installs ÷ product page views |
| Web Referrer | People tapped a link on a website. After a chain of Safari redirects, the last URL gets the credit | 4.0% to 75.1%, installs ÷ product page views |
| App Clip | People tapped a link in your App Clip and then downloaded the app | No public benchmark found |
| Institutional Purchase | Downloads through Apple Business or Apple School Manager | No public benchmark found |
| Unavailable | Downloads before April 15, 2017, or via gift card, promo code or device management software | Not meaningful as a benchmark |
One trap hides in the App Referrer row: on iOS, a tap from a website opened in Chrome or another browser that is not Safari counts as an App Referrer, credited to that browser app, not as a Web Referrer. If your link in bio sends people through an in app browser, check both rows.
Google Play Conversion Rate: How Play Console Measures It in 2026
Google changed the metric this year. According to the Play Console help page on store listing performance, store listing reports were updated in July 2026 to focus on user intent, measured as clicks, and from June 2026 the primary metrics are based on unique clicks. The new click through rate is the percentage of store listing visitors who tapped Install, Open or Pre register, and Google states that it replaces the legacy conversion rate metric. If you search for a Google Play conversion rate in Play Console today, the number you find is this click through rate.
The denominator is narrower than Apple's. Store listing visitors are users who visited your store listing and did not already have your app installed on any of their devices, and a person who visits several times in a day counts once per day. Reports include new users and returning users by default, where returning users are people who installed the app before and have since removed it from all their devices. Store listing acquisitions, the older outcome metric, count users who visited and installed without having the app on another device, so they run lower than raw installs.
Google also limits the traffic in this report. Visitors and acquisitions from other surfaces on Google Play, such as promotional content, are left out, and so are installs from backup and restore. Clicks are counted from three places: the store listing page, the inline install overlay that sometimes appears when someone installs from an ad, and a mini detail page Google may show for searches closely tied to your app. You can split the report by traffic source (Google Play search, Google Play explore, and ads and referrals), by country, by language and by the search term a person typed before reaching your listing.
Play Console gives you a peer comparison as well. The click through rate chart compares your daily performance with your peers' median, 25th and 75th percentiles, and the breakdown table compares your total with the peer median over the last 28 days. Google shows benchmark data only when there is enough data from your selected peer set, and only when you view performance by country, language, install state or traffic source.
So the practical answer to what a play store conversion rate is today has two parts. Inside your console it is unique install clicks divided by visitors who did not already have the app. In third party benchmarks such as AppTweak's 16.15% average it is downloads divided by store listing views, measured by the tool vendor. Expect the two to differ, and compare yourself first with the peer lines Google draws for you.
App Store vs Google Play Conversion Rate: How the Two Consoles Differ
The same app can show a very different rate in each console for reasons that have nothing to do with its listing. This table lines up the two formulas and the tools around them.
| Question | App Store (App Store Connect) | Google Play (Play Console) |
|---|---|---|
| Name of the headline metric | Conversion rate | Click through rate, which replaced the legacy conversion rate in 2026 |
| Numerator | Total downloads (first time plus redownloads) and pre orders | Unique users who clicked Install, Open or Pre register |
| Denominator | Unique devices that saw the app for over a second on Today, Games, Apps or Search | Store listing visitors who did not already have the app on any device |
| People who already had the app | Counted, through redownloads | Counted only if they removed it from every device (returning users) |
| Download straight from search results | Yes, so downloads can exceed page views | Clicks on the inline install overlay shown with some ads count toward the rate |
| Peer benchmarks | 25th, 50th and 75th percentile by category, business model and download volume | Median, 25th and 75th percentile of a peer set, when enough data exists |
| Listing tests | Product page optimization: up to three treatments, one test at a time, up to 90 days | Store listing experiments: up to two variants, one default graphics test or five localized tests at once |
| Alternative listings | Up to 70 custom product pages | Up to 50 custom store listings |
| Published United States average (AppTweak, 2025) | 8.56%, first time downloads ÷ page views | 16.15%, downloads ÷ store listing views |
Sources: Apple metric definitions, Apple product page optimization, Apple custom product pages, Google Play store listing performance, Google Play store listing experiments and Google Play custom store listings, all read October 28, 2026.
App Store Conversion Rate by Category: Every Category for 2025
AppTweak's 2025 averages for the United States App Store, read from the charts in its category benchmark article. The conversion rate column divides first time downloads by product page views. The install rate column divides first time downloads by impressions in search and browse results. Reference has no published install rate.
| App Store category | Conversion rate (page views) | Install rate (impressions) |
|---|---|---|
| Food & Drink | 52.8% | 5.0% |
| Sports | 44.4% | 3.4% |
| Magazines & Newspapers | 44.3% | 2.0% |
| Travel | 42.5% | 5.2% |
| Shopping | 41.0% | 4.6% |
| Books | 40.9% | 3.8% |
| Games: Puzzle | 35.7% | 0.8% |
| Games: Board | 35.6% | 0.6% |
| Games: Card | 35.3% | 2.4% |
| Games: Sports | 34.8% | 2.2% |
| Games: Casual | 34.1% | 1.1% |
| Finance | 33.4% | 5.3% |
| Games: Simulation | 33.4% | 2.7% |
| Games: Strategy | 31.6% | 2.0% |
| Games: Role Playing | 29.9% | 1.9% |
| Games: Family | 28.4% | 0.7% |
| Games (all) | 26.7% | 1.1% |
| Medical | 25.5% | 7.8% |
| Games: Word | 23.3% | 3.4% |
| Entertainment | 22.2% | 1.1% |
| Business | 18.7% | 6.3% |
| Health & Fitness | 18.2% | 5.6% |
| Reference | 18.1% | Not published |
| Weather | 15.6% | 5.8% |
| Lifestyle | 12.4% | 3.3% |
| Games: Music | 12.1% | 1.9% |
| Games: Action | 12.1% | 1.0% |
| Navigation | 11.8% | 7.0% |
| Productivity | 11.5% | 4.4% |
| Music | 10.9% | 4.5% |
| Education | 10.7% | 2.2% |
| News | 10.4% | 3.8% |
| Photo & Video | 10.4% | 4.4% |
| Utilities | 10.4% | 3.8% |
| Games: Racing | 10.2% | 1.5% |
| Social Networking | 9.8% | 1.9% |
| Games: Adventure | 8.6% | 0.7% |
| Games: Trivia | 5.2% | 2.6% |
AppTweak's summary names Navigation as the top install rate category at 7.8%, while its article body and chart give that figure to Medical and show Navigation at 7.0%. We used the chart. AppTweak does not publish its sample size.
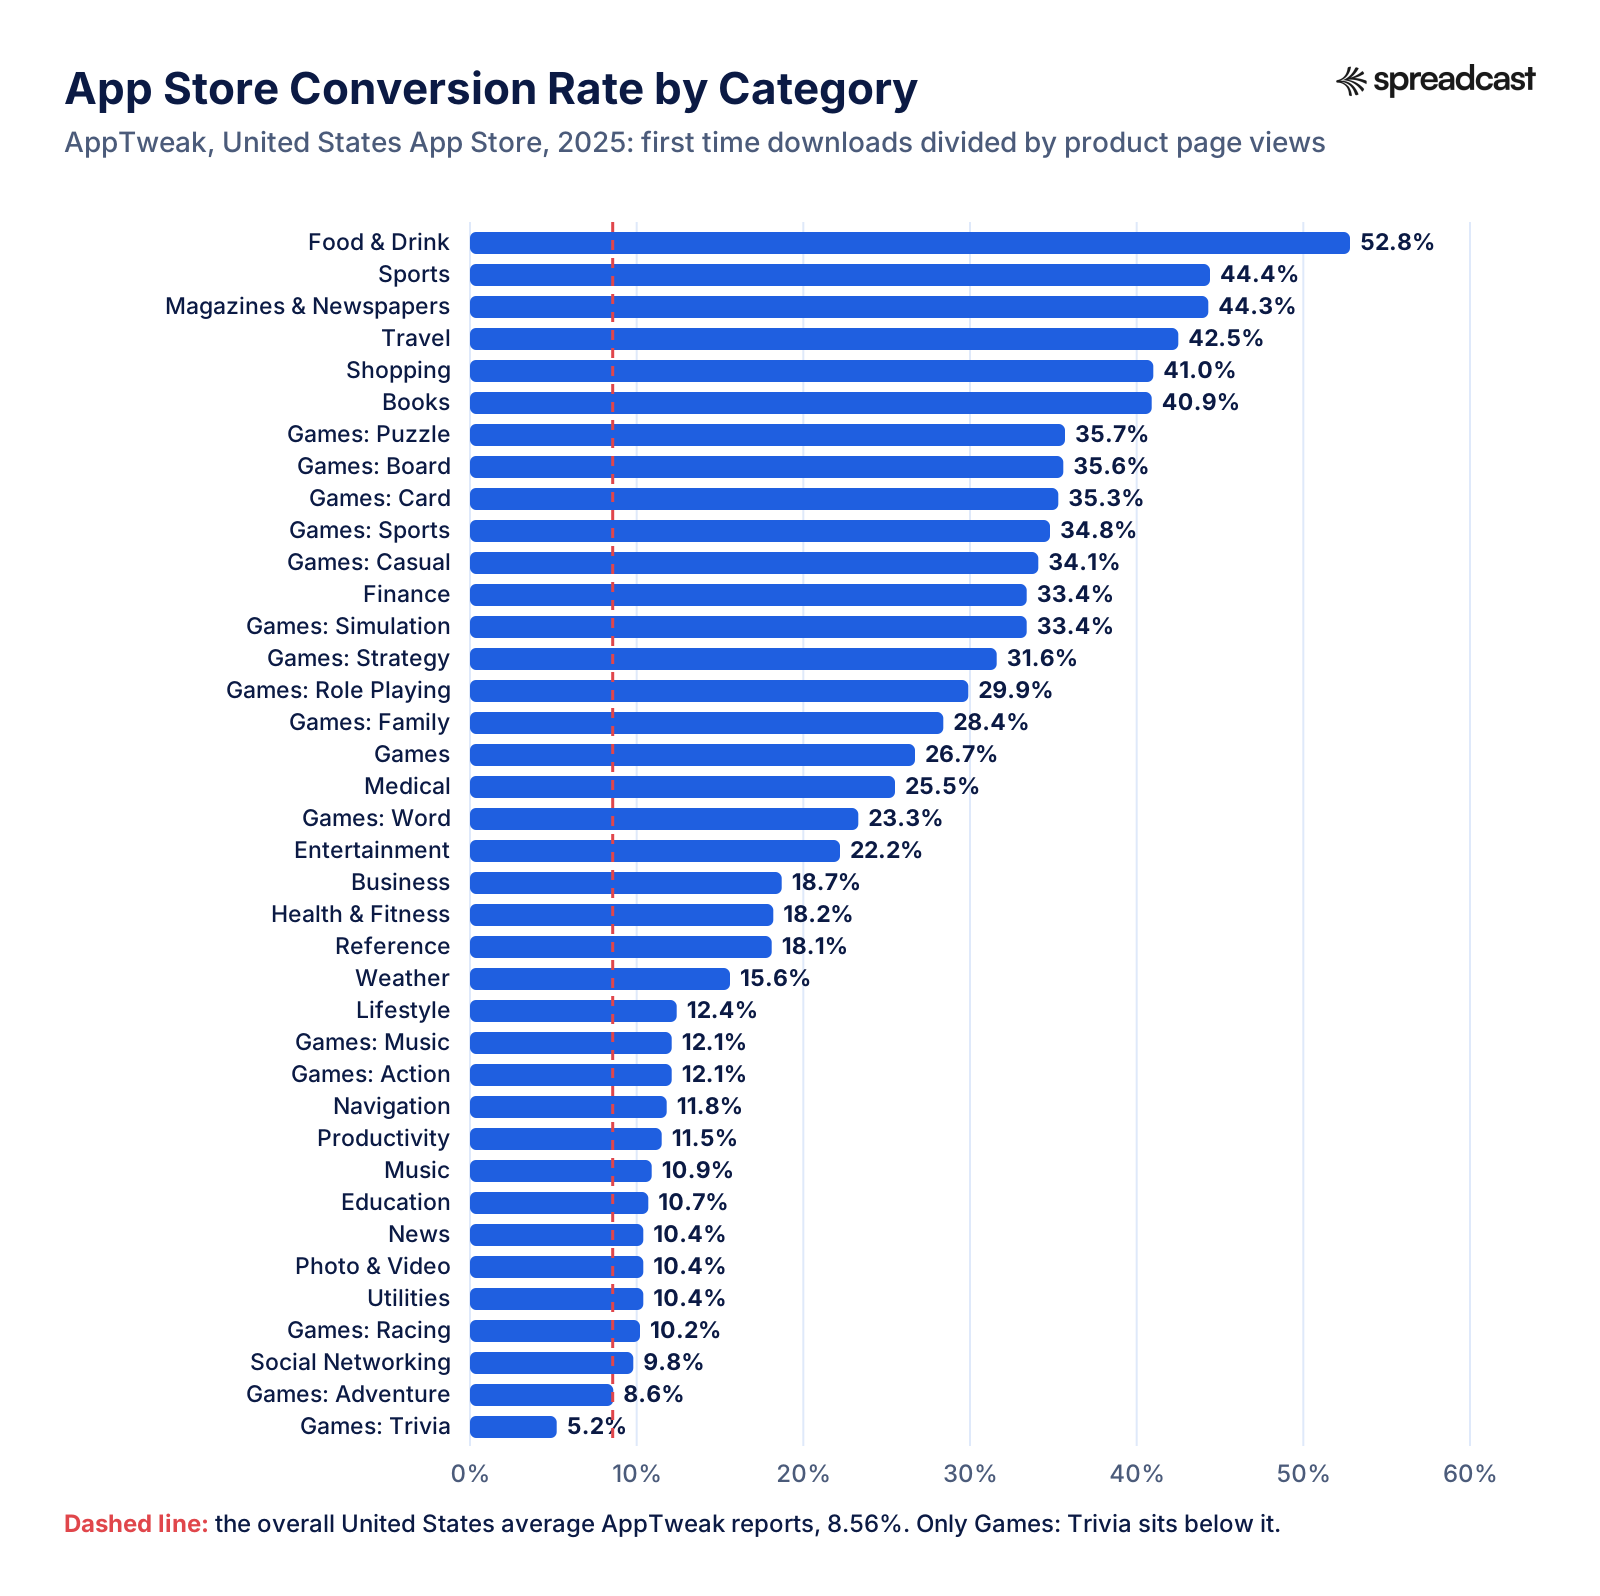
App Store Conversion Rate by Category in One Chart
The same 38 rows drawn as bars, with AppTweak's overall average as a dashed line. Look at where the line falls: almost every category sits to its right.
What the App Store Category Numbers Tell You
Three patterns stand out once the full table is in front of you, and none of them show up in the top and bottom lines most articles quote.
First, the overall average sits below almost every category. Only trivia games, at 5.2%, are under 8.56%, and adventure games at 8.6% barely clear it. A simple average of the categories could not land there. The likely explanation is that the overall figure is weighted by page views, so a handful of very large apps with huge traffic and low rates pull it down, but AppTweak does not say how it averaged. The lesson for you is practical: compare yourself with your category row, not with the headline 8.56%.
Second, conversion rate and install rate tell different stories. Board games convert 35.6% of page views but only 0.6% of impressions, which suggests a search result that rarely earns the tap, followed by a page that closes the deal for the few who open it. Medical apps show the reverse shape at 25.5% and 7.8%: people who search for a specific medical app tend to recognize it and download from the results without opening the page. When your install rate is low and your page view rate is high, the work is on the icon, name, subtitle and first screenshots that appear in results. When both are low, the page itself needs the work.
Third, high rates often mean intent, not craft. Food & Drink, Travel and Shopping top the list because many of their visitors arrive already wanting a specific brand: a restaurant chain, an airline, a store. Social Networking at 9.8% and Productivity at 11.5% sit low because people browse and compare more in crowded categories. A 15% rate is weak for a food ordering app and solid for a to do list.
If your category is not in the table, AppTweak's own benchmark tool covers more countries and channels on a paid plan, and Apple's peer group view inside your account covers every category for free. For what the screenshots of high converting apps look like, our App Store screenshot examples break down real listings category by category.
Google Play Conversion Rate by Category: Every Category for 2025
AppTweak's 2025 averages for Google Play in the United States, downloads divided by store listing views, read from the chart data in the same category benchmark article. The third column pairs each one with the closest App Store category from the table above, which is our pairing, not AppTweak's. Family categories and a few others show no value in the source and are left out.
| Google Play category | Google Play conversion rate | Closest App Store category and rate |
|---|---|---|
| Auto & Vehicles | 62.3% | No App Store category |
| Events | 52.8% | No App Store category |
| Medical | 34.4% | Medical, 25.5% |
| Games: Educational | 33.8% | No App Store category |
| Communication | 33.3% | No App Store category |
| Parenting | 32.4% | No App Store category |
| Beauty | 31.0% | No App Store category |
| Maps & Navigation | 30.9% | Navigation, 11.8% |
| Business | 30.8% | Business, 18.7% |
| House & Home | 30.1% | No App Store category |
| Video Players | 28.5% | No App Store category |
| Dating | 27.9% | No App Store category |
| Transportation | 27.2% | No App Store category |
| Tools | 27.2% | Utilities, 10.4% |
| Music & Audio | 27.0% | Music, 10.9% |
| Games: Music | 26.8% | Games: Music, 12.1% |
| Weather | 26.6% | Weather, 15.6% |
| Productivity | 25.1% | Productivity, 11.5% |
| Personalization | 24.9% | No App Store category |
| Photography | 24.7% | Photo & Video, 10.4% |
| Art & Design | 24.6% | No App Store category |
| Social | 23.9% | Social Networking, 9.8% |
| Education | 23.8% | Education, 10.7% |
| Books & Reference | 22.8% | Books, 40.9%, and Reference, 18.1% |
| Sports | 21.4% | Sports, 44.4% |
| Health & Fitness | 21.1% | Health & Fitness, 18.2% |
| Games (all) | 19.9% | Games (all), 26.7% |
| Games: Trivia | 19.8% | Games: Trivia, 5.2% |
| Shopping | 18.9% | Shopping, 41.0% |
| Entertainment | 18.6% | Entertainment, 22.2% |
| Travel & Local | 18.5% | Travel, 42.5% |
| Games: Action | 17.7% | Games: Action, 12.1% |
| Games: Racing | 17.5% | Games: Racing, 10.2% |
| News & Magazines | 17.0% | News, 10.4% |
| Games: Adventure | 16.5% | Games: Adventure, 8.6% |
| Games: Word | 16.2% | Games: Word, 23.3% |
| Games: Simulation | 16.1% | Games: Simulation, 33.4% |
| Games: Arcade | 14.7% | No App Store category |
| Games: Sports | 13.9% | Games: Sports, 34.8% |
| Games: Casino | 13.7% | No App Store category |
| Finance | 13.7% | Finance, 33.4% |
| Food & Drink | 13.4% | Food & Drink, 52.8% |
| Games: Card | 12.9% | Games: Card, 35.3% |
| Lifestyle | 12.8% | Lifestyle, 12.4% |
| Games: Role Playing | 12.5% | Games: Role Playing, 29.9% |
| Games: Casual | 11.4% | Games: Casual, 34.1% |
| Games: Puzzle | 8.9% | Games: Puzzle, 35.7% |
| Games: Board | 8.2% | Games: Board, 35.6% |
| Games: Strategy | 6.6% | Games: Strategy, 31.6% |
Derived from the two tables: Food & Drink converts 52.8% of page views on the App Store and 13.4% on Google Play, a gap of 39.4 points, the widest of any category in both lists. The gap runs the other way for trivia games, at 5.2% on the App Store and 19.8% on Google Play.
Play Store Conversion Rate vs App Store: Why Google Play Looks Higher
On AppTweak's numbers, Google Play converts almost twice as well as the App Store on average, 16.15% against 8.56%. Before reading that as a verdict on the two stores, look at the shape of each funnel.
On the App Store, a person can download straight from search or browse results without opening your page, which is why AppTweak reports a separate install rate for iOS and notes that an App Store page view rate can exceed 100%. Those downloads go into the numerator while the people who made them never enter the page view denominator, and the people who do open the page are often the undecided ones. AppTweak describes downloading straight from results as an App Store behavior that Google Play does not share, so on its method a Google Play listing view sits closer to the decision and carries more intent.
Category mixes differ too. Google Play splits categories differently (Auto & Vehicles, Events and Parenting have no App Store equivalent), and some apps sit in Business on one store and Finance on the other. Adapty's page warns about exactly this when it compares finance apps across the two stores.
Then there are the audiences. Google Play reaches more people in more markets, and the United States data in both tables covers only one country. If your Android users come mostly from India or Brazil, a United States Google Play average says little about you. Google's peer lines inside Play Console, filtered by country, are the fairer reference.
None of this means one store is easier. It means you should judge each store against its own benchmark and its own peer group, and run listing tests separately on each, because a screenshot set that wins on one can lose on the other. Our iOS app marketing guide covers the iPhone side of that work in more depth.
Why App Store Conversion Rate Benchmarks Disagree: 25% vs 8.56%
If you search for an average App Store conversion rate you will find two numbers repeated across dozens of pages: 25% and 8.56%. Both trace back to AppTweak, a year and a half apart.
The 25% comes from AppTweak's data for the first half of 2024, which Adapty quotes on a page updated January 2, 2026, alongside 27.3% for Google Play. The 8.56% is AppTweak's figure for full year 2025 in its May 2026 article. Same company, same country, same broad definition of downloads divided by page views, and a third of the value. AppTweak does not explain the drop. Its 2025 article even contains a line that calls the App Store average 25%, apparently left over from the earlier edition, which may be how the old number keeps circulating.
The category figures moved even more. In Adapty's copy of the first half of 2024 data, Navigation converts at 115%, Business at 66.7% and Food & Drink at 12.1%. In AppTweak's 2025 charts, Navigation is at 11.8%, Business at 18.7% and Food & Drink at 52.8%. Board games went from 1.2% to 35.6%. Swings that large across a year are more likely to come from a change in sample, weighting or how page views were counted than from people changing how they shop for apps. Treat any single year of vendor data as a rough guide, not a target.
Then add Apple's own number. Apple's custom product pages overview says the average conversion rate on default product pages is 1.6%, and that sending people to a custom product page adds 2.5 percentage points, a 156% increase. Apple does not date the figure or spell out the formula on that page, but its console formula divides by impressions, which would put it in the same family as AppTweak's 3.8% install rate and AppFollow's search ranges, not the page view family.
AppFollow's guide to ASO benchmarks sums up the fix in one line: check the denominator, channel, market and collection period before borrowing any figure. We would add a fifth check, the numerator, because Apple counts redownloads and AppTweak does not.
Same Question, Different Answers: Where the Benchmarks Split
Each row is a question with two published answers and the most likely reason they differ. When the source does not explain a difference, the third column says so instead of guessing.
| Question | One answer | Another answer | Why they differ |
|---|---|---|---|
| Average App Store conversion rate | 8.56% (AppTweak, 2025) | 25% (Adapty citing AppTweak, first half of 2024) | Different periods from the same vendor. AppTweak does not explain the change. |
| Average Google Play conversion rate | 16.15% (AppTweak, 2025) | 27.3% (Adapty citing AppTweak, first half of 2024) | Same as above. |
| Food & Drink on the App Store | 52.8% (AppTweak, 2025) | 12.1% (Adapty citing AppTweak, first half of 2024) | Unexplained. A swing this size points to a change in sample or method. |
| Navigation on the App Store | 11.8% (AppTweak, 2025) | 115% (Adapty citing AppTweak, first half of 2024) | Rates above 100% happen when downloads from search results exceed page views. |
| Conversion on default product pages | 1.6% (Apple, undated) | 8.56% (AppTweak, 2025) | Apple's console divides by impressions. AppTweak divides by page views. |
| Highest App Store install rate | Medical, 7.8% (AppTweak article body and chart) | Navigation, 7.8% (AppTweak summary) | An error in the summary. The chart shows Navigation at 7.0%. |
| Google Play rate inside the console | Click through rate on Install, Open or Pre register | 16.15% downloads ÷ listing views (AppTweak) | Google retired its own conversion rate in 2026 and now measures clicks. |
| Conversion rate on Apple Ads | Over 60% (Apple Ads) | 58.7% for apps using custom product pages, 55.5% without (AppTweak report) | Different samples: all Apple Ads countries against about 2,800 United States advertisers. |
Sources: AppTweak category benchmarks, Adapty, Apple custom product pages, Apple Ads, AppTweak's 2026 benchmarks report and Google Play help, read October 28, 2026.
What Is a Good App Store Conversion Rate?
A good App Store conversion rate is one that beats the median of apps like yours, measured with the same formula you use. That sounds evasive, but it is the only answer that holds up, because the published figures run from 1.6% to over 60% depending on definition and category.
Inside App Store Connect, use the peer group benchmarks. Apple compares your conversion rate with the 25th, 50th and 75th percentile of a peer group built from your primary category and business model, and you can narrow the group by download volume. Apple builds these values with differential privacy, checks every week that each peer group holds enough apps before releasing it, and adds noise to each data point, which is why it calls them directional rather than an exact ranking. They still use exactly the same formula as your dashboard, which no public benchmark does.
Here is how we read the three lines. Below the 25th percentile, your page or your traffic has a problem worth fixing before you spend on anything else. Between the 25th and 50th, you are typical, and one or two good tests can move you up. Above the 75th, the page works, and growth will come from more impressions rather than better conversion. For Google Play, read the same three percentiles from the click through rate chart in Play Console.
If you need a public reference, for a pitch deck or because your app is too new for benchmarks, use AppTweak's category row and say which definition it uses. For a United States App Store app, a page view rate around your category's figure in the table above is normal. For a new app with few ratings, expect to sit below it at first, because a product page with no rating has less to work with.
Two more numbers help put a rate in money terms. Our cost per install benchmarks show what paid installs cost by country and category, and a better conversion rate lowers that cost directly: if an ad tap costs $1.00 and 60% of taps install, each install costs about $1.67 (derived: $1.00 ÷ 0.60). At 40% the same tap makes each install cost $2.50. And the LTV to CAC ratio guide shows how those install costs compare with what a user is worth.
App Conversion Rate Worked Example: One Month, Four Answers
Alex runs a small habit tracker. The numbers below are made up for illustration, not data, and show how one month of traffic produces four different conversion rates depending on the formula.
| Measure | Alex's month | Formula | Result |
|---|---|---|---|
| Unique device impressions | 20,000 | From App Store Connect | Input |
| Product page views | 1,400 | From App Store Connect | Input |
| First time downloads | 600 | From App Store Connect | Input |
| Redownloads | 200 | From App Store Connect | Input |
| App Store Connect conversion rate | 800 total downloads | (600 + 200) ÷ 20,000 | 4.0% |
| Page view conversion rate (AppTweak style) | 600 first time downloads | 600 ÷ 1,400 | 42.9% |
| Install rate (AppTweak style) | 600 first time downloads | 600 ÷ 20,000 | 3.0% |
| Page view rate (impressions to page) | 1,400 page views | 1,400 ÷ 20,000 | 7.0% |
Alex's 4.0% in App Store Connect and 42.9% on an ASO tool describe the same month. Neither is wrong. If Alex compares the 4.0% with AppTweak's 8.56% average and decides the page is failing, the comparison is the mistake, not the page.
Mobile App Conversion Rate and App Install Conversion Rate: Which One Do You Mean?
The phrase mobile app conversion rate gets used for at least three different stages, and teams waste time because two people in a meeting mean different ones.
The store stage is everything above: how often someone who sees the app downloads it. The ad stage is the tap through install rate an ad network reports, such as Apple Ads' figure of over 60% for ads at the top of search results, where the person has already chosen to tap. The in app stage is what happens after the download: finishing onboarding, starting a trial, paying. Apple now covers that last one with day 35 download to paid conversion, and subscription platforms report their own trial to paid rates.
An app install conversion rate, in most ad dashboards, is installs divided by clicks or taps on the ad. In App Store Connect there is no metric with that exact name, and the closest equivalent is conversion rate filtered to a campaign. When a partner, an investor or an agency asks for your install conversion rate, ask which denominator they want: impressions, page views or ad taps.
For the in app stage, our app retention benchmarks show how many people keep using an app after day 1, day 7 and day 30. A product page that converts well but sets the wrong expectation shows up there as a steep drop on day 1, so the two pages are worth reading together.
How to Improve App Store Conversion Rate: 12 Changes That Move It
Each change below is tied to what Apple's own guidance says the element does. Make one change at a time and give it at least two weeks, or a test, so you know which change moved the number.
Make the First Three Screenshots Do the Selling
Apple's product page guidance allows up to 10 screenshots and says the first one to three appear in search results when no app preview is available. Those images reach far more people than the rest of the page. Put one benefit per screenshot in large type, show the real interface in a device frame (our iPhone mockup generator does this for free), and check the files with the App Store screenshot size checker. To build a second set for a test, the free App Store screenshot generator puts a headline and an iPhone frame on each screen and exports them at an accepted size.
Open the App Preview With Something Worth Watching on Mute
Apple allows up to three app previews of up to 30 seconds, and they autoplay with the sound off. The first seconds decide whether anyone keeps watching, so start with the core action, not a logo. Our guide to the App Store app preview video covers specs and pacing.
Say What the App Does in the Name and Subtitle
Both fields hold 30 characters and appear in search results, so they are part of the install rate as well as ranking. Write the plain job of the app, the words people actually search for. The App Store character counter checks each field against its limit, and the App Store optimization guide covers keyword choice.
Earn a Rating People Can See
Apple says ratings and reviews influence search ranking and can encourage people to engage from search results, and that having few ratings may discourage downloads. You can show the system rating prompt up to three times in a 365 day period, per Apple's ratings page. Ask after a completed task, and reply to reviews. The method is in our guide on how to get App Store reviews.
Use the Promotional Text for News
The promotional text sits at the top of the description, holds 170 characters and can change at any time without a new version. Apple notes it does not affect search ranking, so use it for the reason to download this week: a new feature, a seasonal offer, an award. Keep the first sentence of the description just as direct, because that is all people read without tapping more.
Send Each Audience to Its Own Custom Product Page
You can publish up to 70 custom product pages, each with its own screenshots, promotional text and previews, and assign keywords so a custom page shows in search for those terms. Apple reports an average lift of 2.5 percentage points when people are sent to one. Yet AppTweak's 2026 benchmarks report found that 61% of apps and 74% of games among about 2,800 United States Apple Ads advertisers ran none. That gap is an opening for a small team.
Test Before You Ship a New Look
Product page optimization tests up to three alternate versions of your icon, screenshots and previews against the original. AppTweak found that around 90% of top apps never tested their icon on the App Store and 88% never tested a video, so even a basic test puts you ahead of most of the store.
Run In App Events So Returning Users See Something New
In App Events appear on your product page, in Today, Games and Apps, and in search results, where people who downloaded your app before see the event card while new visitors see your screenshots. You can have up to 10 events published at a time, each lasting up to 31 days. Our App Store in app events guide has examples.
Prepare Creative Assets for iOS 27 Search Results
Apple's asset best practices describe creative assets that appear in iOS 27 and iPadOS 27 on the product page header, in search results and in featuring. Your search result asset is the first thing people see through the Search tab, before your page. Apple advises one clear idea per asset, a design for first time visitors, and a 4+ age rating for every asset whatever your app's rating. Test header visuals with product page optimization.
Localize the Screenshots, Not Only the Text
Apple recommends localizing the description, keywords, app previews and screenshots for each market. A translated caption on an English screenshot reads as an afterthought. Start with the market that sends the most impressions after your home one, which App Analytics shows by territory.
Match the Page to the Traffic You Send
A visitor from a post about one feature lands on a page that leads with a different one, and leaves. Point each campaign at the custom product page that shows what the post promised, and tag the link so App Analytics shows whether it worked. Mismatched traffic is the most common reason a good page posts a poor rate from web and app referrers.
Turn Each Release and Rating Milestone Into a Reason to Look
New versions and rating milestones are the moments when your page has the most to show, yet most of the people who would care never open the store that week. Spreadcast watches your App Store listing every day, and when a new version goes live or the app reaches a ratings milestone, it designs the post in your brand, writes the caption for each network and publishes it, so people who already know the app come back to a page that now has more to show.
Video: Apple on Using Images and Video Across the App Store
Apple's WWDC26 session on the new visual placements: the product page header, search result assets, Apple Ads creative and the Asset Library. It is the best primary source on where your images will appear in iOS 27.
How to Run a Product Page Optimization Test on the App Store
The setup below follows Apple's product page optimization overview. Testing is the only way to know whether a change raised your conversion rate rather than a busy week doing it for you.
- Step 1
Pick One Element to Test
You can test the icon, screenshots and app previews. Apple lists those three and no text fields, so the name, subtitle and description cannot be tested here. Change one element per treatment, or you will not know which change won.
- Step 2
Build Up to Three Treatments
Each treatment is an alternate version of the page. A first test for a small app might pit the current first screenshot against one that leads with the main benefit in larger type.
- Step 3
Choose the Traffic Share
Apple's example: allocate 40% of traffic to a test with two treatments and each treatment gets 20%, while the original keeps 60%. A small app should give the test as much traffic as it can stand, or the test will run out of time before reaching a result.
- Step 4
Read the Estimate Before You Start
App Store Connect estimates how long the test needs and how many impressions it takes to reach an outcome with at least 90% confidence, based on the conversion rate you select. If the estimate runs past 90 days, the maximum, test a bolder change.
- Step 5
Let It Run, Then Apply the Winner
Treatments show on iOS and iPadOS 15 or later, and each person sees the same treatment for the whole test. Apple recommends waiting until a treatment is declared better or worse than the baseline with at least 90% confidence before you apply it or stop the test.
- Step 6
Record the Result and Plan the Next Test
You can run one test at a time. Write down what won, by how much and in which source types, then queue the next element. Apple's Peak Brain Training example shows what a real result looks like: of three treatments run for 44 days, one raised conversion by 8% and the other two lowered it by 2.9% and 3.5%. Wins are usually a few percent, and losing treatments are common, which is exactly why the test is worth running.
How to Improve Google Play Conversion Rate
Google Play gives you a stronger testing tool than Apple in one respect: you can test text. Store listing experiments let you run one default graphics experiment, covering icon, feature graphic and screenshots in your default language, or up to five localized experiments at the same time, which can also test your descriptions. Each experiment can have up to two variants against the current listing. Google now judges experiments on unique install clicks, open clicks or pre registration clicks, the same intent metrics as the new reports, and lets you set the minimum detectable effect and the confidence level. Experiments stop on their own after six months.
Google's own store listing experiments page lists the practices that work: test icons, videos and screenshots for the biggest impact, test a single asset at a time, run each test for at least a week to cover weekday and weekend traffic, and revisit assets as users, locations and seasons change. The same page features developer results such as Kongregate's reported 45% increase in installs, which are the developers' own figures.
The assets themselves follow Google's preview asset guidance. The preview video plays from the feature graphic before the screenshots, and may autoplay muted for up to 30 seconds, so Google recommends showing core content in the first 10 seconds. Screenshots come next, and the first three should show the interface. You can add up to 8 screenshots per device type, and Google recommends at least four for phone apps. The short description, 80 characters, is the first text people read on the details page.
For different audiences, Google offers up to 50 custom store listings, targeted by segments such as country or region, search keywords, ads traffic, pre registration, churned or lapsed users, and custom audiences. A custom listing for lapsed users that leads with what changed since they left is the Google Play counterpart to an Apple In App Event shown to past users.
If you publish on both stores, test on both. A screenshot set that wins on one can lose on the other because the audiences and the layouts differ. Size rules for both stores are in our App Store screenshot sizes reference.
Video: Google Play on Store Listing Experiments
A session from Google's App Excellence Summit on store listing experiments and how to surface offers on the listing. The interface has changed since 2022, but the testing logic it explains still applies.

Traffic Quality: Why Social and Web Visitors Convert Differently
Look again at AppFollow's August 2026 ranges. Web referrer installs ran from 4.0% to 75.1% of product page views across category medians, and app referrer installs from 4.5% to 53.0%. The spread is wider than in any other source type because the visitor's intent varies so much. Someone who tapped a link in a friend's message to download the app converts at a very different rate from someone who tapped a banner out of curiosity.
That is good news for anyone with an audience. A visitor who has already seen your app in a post, a video or a newsletter arrives with context: they know what it does, and the product page only has to confirm it. That is the opposite of a search visitor, who is often comparing five apps at once.
To see whether that traffic converts, tag it. Apple's campaign links add a provider token (pt), a campaign token (ct) and a media type token (mt) to your App Store URL. The campaign token holds up to 30 characters. A campaign appears in Analytics 24 hours after launch, once it has first time downloads from at least five people, and each metric appears once it reaches a threshold of 5 in the selected range. The free App Store campaign link generator builds the link for you, with one campaign token per network or per post.
Tip: if you post about your app on several networks but never know which ones bring downloads, give each network its own campaign token and read conversion rate by campaign after a month. When the posting itself is the part you never get to, Spreadcast designs the posts from your App Store listing and publishes them to Instagram, TikTok, LinkedIn, Threads, Bluesky and the rest, so the tagged links actually go out every week.
Social traffic also has a floor problem. Apple hides campaign data below five first time downloads, so a single post rarely shows up on its own. Group posts into one campaign per network per month, and judge the network, not the post. Our guide to promoting an app on social media covers which networks tend to send app installs.
Video: Reading Acquisition and Conversion in App Store Connect
Apple's September 2026 session on the acquisition side of App Store Connect Analytics: where downloads come from, which metrics matter and which features can raise them.

Conversion Rate Mistakes That Skew the Number
Most surprises in a conversion rate chart are measurement effects rather than changes in how well the page sells. Check these before you redesign anything.
Reading a Featuring Day as a Failure
Being featured in Today or Apps adds a wave of browse impressions from people who were not looking for you, and browse installs ran at only 0.1% to 2.5% of impressions in AppFollow's data. Your rate drops while your downloads rise. Read downloads and rate together, and split by source type.
Counting Ad Traffic as Organic
App Store Search includes views and downloads from ads in search results. Ads convert far better than organic results, so starting a campaign can make your search conversion look healthier than your page really is. Compare periods with and without ads, or read the ads data separately.
Celebrating a Redownload Spike
Because Apple counts redownloads, a win back email or a viral moment among past users lifts your rate without any new users. Check first time downloads alongside total downloads before you credit a new screenshot.
Comparing Your Console With a Blog Average
Your App Store Connect rate divides by impressions. Most blog averages divide by page views. The worked example above shows the same month reading 4.0% and 42.9%. Compare like with like or not at all.
Judging a Week of Data on a Small App
Apple shows no conversion rate until you have five first time downloads or pre orders, and small numbers swing wildly above that floor. A move from 3% to 5% on 100 impressions is two downloads. Use 28 days or more, and a product page optimization test when you need a real answer.
Using an Old Benchmark as a Target
AppTweak's own App Store average fell from 25% in its first half of 2024 data to 8.56% for 2025, and some categories moved by 40 points. Pages that still quote the older figure set targets nobody can hit. Date every benchmark you put in a plan.
Forgetting That Chrome Taps Are App Referrals
On iOS, Apple attributes taps from websites opened in Chrome and other browsers that are not Safari to that browser as an app referrer. If your web referrer rate looks thin, the missing visitors may be sitting in the App Referrer row.
Ignoring the Peer Group You Are In
Apple builds the peer group from your primary category and business model. If you changed category, or your business model changed from paid to free with purchases, your peers changed too. Check which group you are comparing with before you read the percentiles.
Apple App Store Conversion Rate and Search Ranking
Does a better conversion rate help you rank? Apple does not use the words conversion rate when it explains ranking. Its search page says search results are based on text relevance, meaning matches for your title, subtitle, keywords and primary category, and on user behavior, naming downloads, ratings and reviews. A page that turns more of the same impressions into downloads raises one of those inputs, so the link is plausible, but Apple publishes no formula and neither do we.
The search page adds two details that matter for the install rate. Your rating and up to three screenshots or app previews may appear in results, depending on platform and orientation. And search results may now show app tags, which Apple generates with large language models from the metadata you entered in App Store Connect. The tags are another reason to keep the subtitle and description literal: whatever you write there may come back as a label under your app in results.
Search is the largest door into the store. Apple Ads states that 70% of App Store visitors use search to discover apps and that almost 65% of downloads happen directly after a search, both for the App Store worldwide in 2022. That makes the search result, not the full product page, the place where most of your conversion rate is decided.
If your app is new and has few impressions, conversion rate work has a ceiling. The how to get featured on the App Store guide and the how to market an app playbook cover how to grow the impressions side.
App Store Conversion Rate Checklist: What to Check Each Month
A short routine for a small team. It takes about half an hour once the views are saved, and catches most problems before they cost a month of downloads.
| Check | Where | What a problem looks like |
|---|---|---|
| Conversion rate by source type, last 28 days | App Store Connect, Analytics, Metrics | Search below your peer median while browse is fine: the result card needs work |
| Peer group percentile for conversion rate | App Store Connect, peer group benchmarks | Below the 25th percentile for two months in a row |
| First time downloads against redownloads | App Store Connect, Analytics | Total downloads up, first time downloads flat |
| Conversion by campaign | App Store Connect, filter by campaign | A network sending page views but almost no downloads |
| Custom product page against default | App Store Connect, filter by product page | A custom page converting below the default one |
| Active product page optimization test | App Store Connect, product page optimization | No test running for more than a month |
| Rating and rating count per territory | App Store Connect, ratings and reviews | A new version with a burst of low ratings |
| Google Play click through rate against peers | Play Console, store performance | Below the peer 25th percentile in a main country |
| Google Play experiments | Play Console, store listing experiments | No experiment running, or one stuck on more data needed |
| Screenshot and preview freshness | Both stores | Screenshots that show a design you replaced two versions ago |
AppTweak's 2026 benchmarks report found that 54% of the top 1,000 United States apps updated their App Store screenshots at least twice in 2025, and 46% on Google Play. Twice a year is a reasonable floor for a small app too.
Where Spreadcast Fits: More Product Page Visits From People Who Already Care
Everything above works on the page. The other half of conversion is who arrives. A product page converts best for people who already know what the app does, and the cheapest way to create those people is to keep showing the app where they spend time: Instagram, TikTok, LinkedIn, Threads, Pinterest and the rest.
Most small teams know this and still do not post, because each post means a design, a caption per network and a login per network. Here is what that looks like by hand: open the release notes, crop a screenshot, place it in a frame in a design tool, write an Instagram caption, rewrite it for LinkedIn, shorten it for Threads and Bluesky, upload four times, then remember to tag the App Store link. For a team that ships every two weeks, that is an afternoon lost every two weeks.
With Spreadcast, you paste your App Store link at the start page once. It builds a brand kit from the listing: your icon, colors and screenshots in an iPhone frame. Then it checks your App Store listing every day, and when a new version goes live or the app reaches a ratings milestone, it designs the post, writes a caption for each network and publishes it to Instagram, Facebook, Threads, LinkedIn, Pinterest, TikTok, YouTube, Bluesky, Mastodon, Telegram and Discord, on full autopilot or after one tap of approval. For anything else, you type one line in Create, or pick one of twelve app post types such as a feature, a how to or a testimonial.
You keep the measurement side. Put a campaign token from the campaign link generator in the link you share, and App Analytics shows the conversion rate of the visitors your posts bring. Spreadcast's own analytics show followers and interactions per network and likes, comments, reach and views per post, so you can see which network earns attention and which one earns downloads.
The free plan makes 3 posts for one app to download, with a small Spreadcast mark. Pro is $29 a month or $290 a year and includes clean posts with no cap, publishing to 10 social accounts across any mix of networks, autopilot or one tap approval, and posting from Claude or ChatGPT through the Spreadcast MCP server. If you want to try it around a single launch, the Post Pack is $19 once for 10 posts designed and published. All of it is on the pricing page, with a 7 day full refund on paid plans. It makes image posts and carousels, so keep a video editor for app previews.
Our mobile app marketing hub and the App Store update announcement examples show what those posts look like for real apps.
Frequently Asked Questions
What is a good app store conversion rate?
A good rate beats the median of apps like yours under the same formula. In App Store Connect, compare with the 25th, 50th and 75th percentiles in peer group benchmarks. As a public reference, AppTweak puts the United States App Store average at 8.56% of page views in 2025, with categories from 5.2% to 52.8%.
What is the average app store conversion rate?
AppTweak reports 8.56% for the United States App Store in 2025, dividing first time downloads by product page views, and 16.15% for Google Play. The 25% figure many pages still quote is AppTweak's first half of 2024 data. Apple cites 1.6% for default product pages, measured against impressions rather than page views.
How is conversion rate calculated in App Store Connect?
Apple divides total downloads and pre orders by unique device impressions. Total downloads include redownloads, and an impression is a view of at least one second on the Today, Games, Apps or Search tabs. The full definitions are in Apple's metric definitions.
Why is my app store conversion rate over 100%?
That happens on tools that divide downloads by product page views. On the App Store people can tap Get in search or browse results without opening your page, so downloads can exceed page views. App Store Connect's own rate divides by impressions and stays below 100% in normal use.
Where do I find conversion rate in Google Play Console?
Google replaced the legacy conversion rate with a click through rate in 2026: unique Install, Open or Pre register clicks divided by store listing visitors who did not already have the app. It sits in the store performance reports under Grow users, per Google's help page, with peer percentiles beside it.
What is the difference between conversion rate and install rate?
In AppTweak's terms, conversion rate divides first time downloads by product page views, and install rate divides them by impressions in search and browse results. The United States App Store averages were 8.56% and 3.8% in 2025. AppTweak reports install rate only for the App Store, because it says App Store visitors can download straight from search or browse results and Google Play visitors cannot.
How do I improve my app store conversion rate?
Start with the first three screenshots and the app preview, since they appear in search results. Then earn ratings, send each audience to a custom product page, and test changes with product page optimization. Change one element at a time and wait at least two weeks or for a test result.
Does conversion rate affect App Store ranking?
Apple does not name conversion rate as a ranking factor. Its search page names text relevance plus user behavior such as downloads, ratings and reviews. More downloads from the same impressions feed one of those signals, but Apple publishes no formula.
Where These Facts Come From
Every outside number, rule and price on this page links to the page it was taken from.
- Metric definitions for App Store Connect AnalyticsApple Developer
- App Store Connect Analytics overviewApple Developer
- Acquisition source typesApp Store Connect Help
- Peer group benchmarksApp Store Connect Help
- Campaign linksApp Store Connect Help
- Custom product pagesApple Developer
- Product page optimizationApple Developer
- Creating your product pageApple Developer
- App Store searchApple Developer
- In App EventsApple Developer
- App Store asset best practices for iOS 27Apple Developer
- Ratings, reviews and responsesApple Developer
- 2025 App Store Transparency ReportApple
- Ads on the App Store: conversion and search figuresApple Ads
- Understand and grow your app's user base: store listing performancePlay Console Help
- Run A/B tests on your store listingPlay Console Help
- Store listing experiments: best practicesGoogle Play Console
- Create custom store listings to target specific user segmentsPlay Console Help
- Add preview assets to showcase your appPlay Console Help
- Average app conversion rate per category, 2025 (May 18, 2026)AppTweak
- ASO and Apple Ads trends and benchmarks report 2026 (July 13, 2026)AppTweak
- App Store conversion rate benchmarks (updated January 2, 2026)Adapty
- ASO benchmarks 2026: four checks to run before you trust a numberAppFollow
- WWDC26: Enhance your presence on the App StoreApple Developer
- Google Play store listings: store listing experimentsAndroid Developers
- Enhance your acquisition strategy with App Store Connect AnalyticsApple Developer
Researched and written by Spreadcast. Last checked on October 28, 2026.