Social Media Statistics 2026: What This Page Covers
Most social media statistics pages repeat the same twenty numbers, half of them two years old and a few of them invented somewhere along the chain of copies. This page goes back to the people who measure: DataReportal's Digital 2027 Global Overview Report published on October 21, 2026, the companies' own earnings releases, the Pew Research Center for the United States, and the IAB for advertising money. Every figure names its publisher and the period it covers in the same sentence or table row.
The short version for 2026: 5.81 billion social media user identities were active in October 2026, equal to 69.9% of everyone on Earth. The typical online adult spends 19 hours and 18 minutes a week on social media and online video together. Meta alone counts 3.64 billion people using at least one of its apps every day. In the United States, 84% of adults use YouTube and 70% use Facebook. Advertisers spent $117.7 billion on social media in the US in 2025, 40% of all digital ad money.
The page is built for three kinds of reader. If you need one number for a slide, the table right below has the eighteen people look for most. If you are choosing where a brand should post, the platform tables and the time spent section tell you where the attention is and how each company counts it. If you are writing a report or a budget, the methodology table at the end shows where sources disagree, so you can quote the right figure and not the loudest one.
A note on scope. Spreadcast publishes to eleven networks: Instagram, Facebook, Threads, LinkedIn, Pinterest, TikTok, YouTube, Bluesky, Mastodon, Telegram and Discord. All eleven get a row with a sourced number, and so do WhatsApp, Messenger, Snapchat, Reddit and X for context, which makes sixteen platforms. Two networks have their own deeper pages: Bluesky statistics and Threads statistics. For app numbers rather than social numbers, see our App Store statistics.
How We Researched These Social Media Statistics
We opened every source on October 28, 2026 and read the figure on the page itself, not in a roundup that quotes it. For worldwide numbers we used DataReportal's three latest global reports: the October 2025 edition, the April 2026 mid year update and the October 2026 edition. Those reports combine company ad tools, GWI's survey of internet users aged 16 and above, and Similarweb's app usage panel, and they say which is which. We kept the three data types apart here too, because mixing them is the most common error on other pages.
For user counts by platform we went to the company first: earnings releases from Meta, Pinterest, Snap and Reddit; the LinkedIn pressroom; the YouTube press page; Bluesky's transparency report; and the statistics feed Mastodon's own site publishes. Where a company only announced a milestone, such as Instagram reaching 3 billion monthly users, we cite the news report that quotes the executive and say so.
Three rules hold everywhere. A number always carries its type: monthly active users, daily active users, registered accounts, members, ad reach and survey share are six different things, and we name which one each figure is. Anything we calculated ourselves is marked derived and shows its arithmetic. And when two good sources disagree, both appear in the methodology table instead of being averaged into a figure nobody published.
Meta's third quarter release came out on October 21, 2026, and its figures are in the tables. Pinterest, Snap and Reddit had not yet published their third quarter numbers on the day we checked, so their rows use the second quarter 2026 releases from late July and early August, and they will move when the new releases land in the coming weeks.
Key Social Media Statistics for 2026 at a Glance
The numbers people search for most, each with the page it comes from. Click through before you quote one; that is what the links are for.
| Statistic | Figure | Publisher and period |
|---|---|---|
| Active social media user identities worldwide | 5.81 billion | DataReportal, Digital 2027, October 2026 |
| Share of the world's population | 69.9% | DataReportal, Digital 2027, October 2026. The UN figure behind it is 8.32 billion people. |
| Growth in user identities over 12 months | +151 million (+2.7%) | DataReportal, Digital 2027, October 2025 to October 2026 |
| Internet users worldwide | 6.15 billion (73.9%) | DataReportal, Digital 2027, start of October 2026 |
| Online adults who used a social network or messenger in the past month | 97.1% | GWI survey of internet users aged 16 and above, in DataReportal, Digital 2027 |
| Weekly time on social media and online video, per online adult | 19 hours 18 minutes | GWI, in DataReportal, Digital 2027. Derived: about 2 hours 45 minutes a day. |
| Weekly time scrolling social media feeds alone | 7 hours 13 minutes | GWI, in DataReportal, Digital 2027 |
| People using at least one Meta app each day | 3.64 billion | Meta, third quarter 2026 results, average for September 2026 |
| Instagram monthly active users | 3 billion | Mark Zuckerberg, September 24, 2025, reported by CNBC |
| App with the most time per user per day | TikTok, 1 hour 55 minutes | Similarweb app data in DataReportal, Digital 2027, August 2026 |
| US adults who use YouTube | 84% | Pew Research Center, survey of January 30 to June 18, 2026 |
| US adults who use Facebook | 70% | Pew Research Center, same survey |
| US adults who get news from social media at least sometimes | 59% | Pew Research Center, survey of August 24 to 30, 2026 |
| US social media ad revenue | $117.7 billion, up 32.6% | IAB and PwC, full year 2025, released April 16, 2026 |
| Social media's share of US digital ad revenue | 40.0% | IAB and PwC, full year 2025 |
| Online adults who discover brands through social media ads | 30.4% | GWI, second quarter 2026, in DataReportal, Digital 2027 |
| Online adults who use social networks to research brands | 41.8% | GWI, second quarter 2026, in DataReportal, Digital 2027 |
| Marketers who use AI to create content | 80% | HubSpot State of Marketing 2026 |
All rows read on October 28, 2026. GWI figures are survey answers from internet users aged 16 and above in the countries it covers; Similarweb figures cover Android and iOS apps only, not web use, and leave out China.
How Many People Use Social Media in 2026?
About 5.81 billion, if you use the standard global figure. DataReportal's Digital 2027 Global Overview Report puts monthly active social media user identities at 5.81 billion at the start of October 2026, which is 69.9% of the world's 8.32 billion people. The same report counts 6.15 billion internet users, so social media identities equal about 94% of the online population (derived: 5.81 ÷ 6.15).
The word identities matters. The figure starts from the largest ad audience each platform reports in each country, adjusted with other data, and a person with two accounts can be counted twice while a person who never sees ads may be missed. DataReportal says plainly that user identities may not represent unique human individuals. In some countries the adult ad reach of a platform is larger than the adult population, which tells you the inputs are not a census.
Survey data gives a check that does not depend on ad tools. GWI, quoted in the same report, found that 97.1% of online adults used a social network or a messaging app in the past month. Japan was the only country in its survey below 90%. The April 2026 update ran the check the other way: apply GWI's adult usage rate to all adult internet users, add GWI's Kids survey rate for users under 16, and you get 5.95 billion people, about 2.7% above the identities figure. Two methods, a 140 million gap, and both say roughly seven in ten humans use social media.
So how many people use social media? Say 5.8 billion user identities in October 2026, or about 70% of the world, and name DataReportal as the source. If someone needs a count of unique people, the honest answer is that nobody publishes one, and the survey based estimate lands within 3% of the identities figure.
Social Media Users Over Time
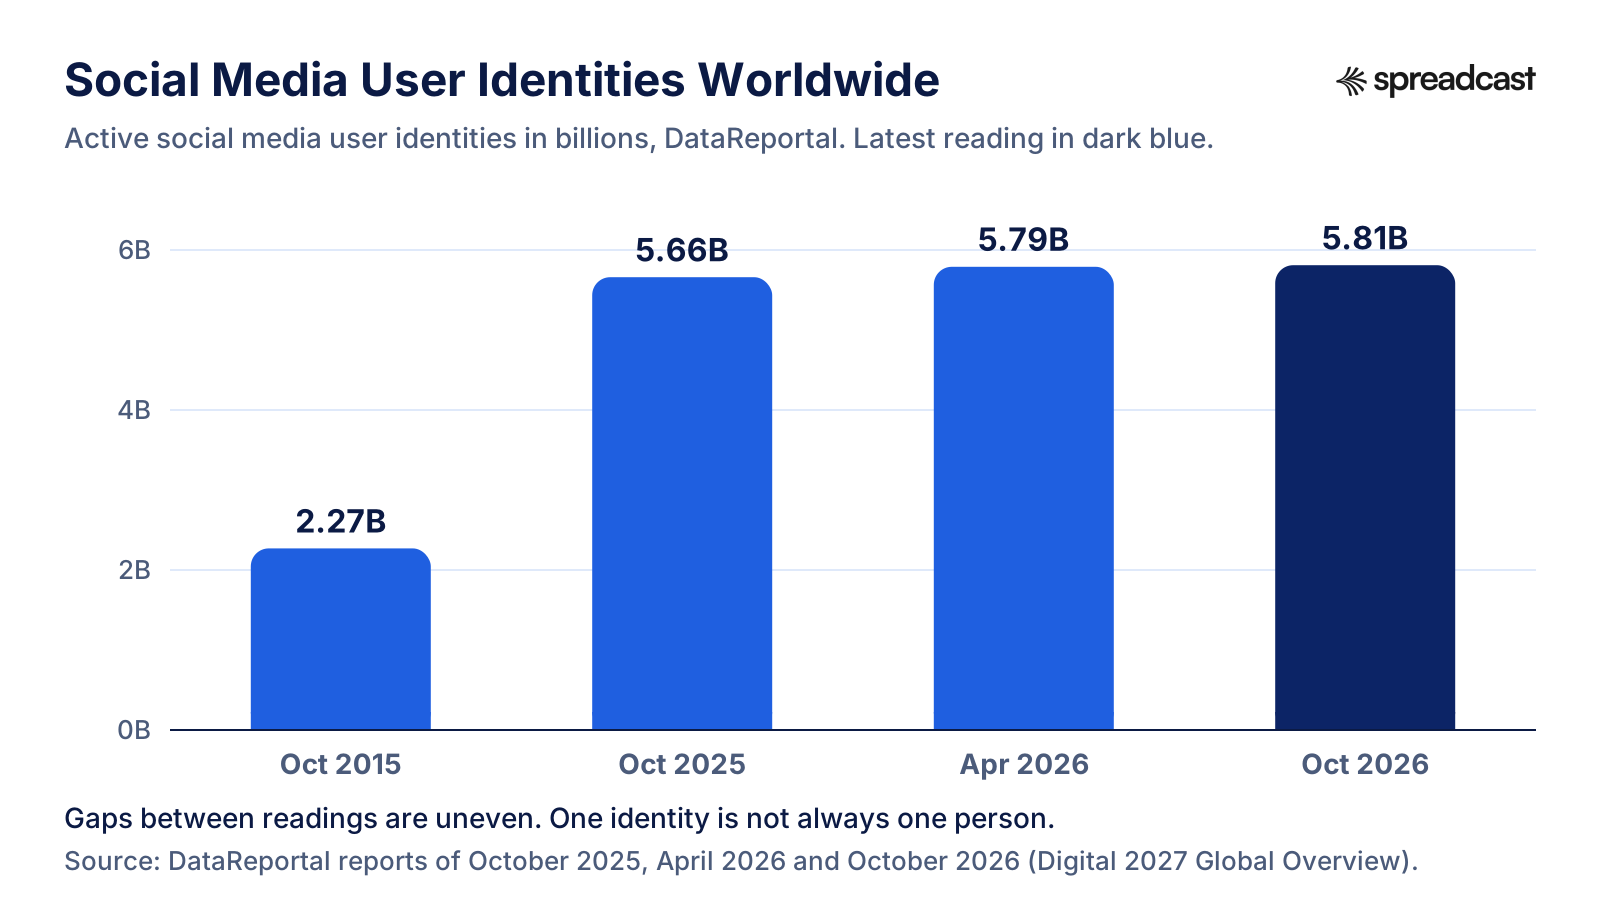
Four readings from the same publisher, drawn to scale from zero. The last three are six months apart; the first is ten years earlier.
Why Social Media User Growth Slowed in 2026
Growth did not stop, but it slowed sharply. The October 2025 report counted 259 million new user identities in the year to October 2025, a rise of 4.8%. The April 2026 update counted 294 million in the year to April, a rise of 5.4%, or more than 800,000 new users a day. The October 2026 report counts only 151 million in the year to October 2026, a rise of 2.7%, or about 414,000 a day (derived: 151 million ÷ 365).
The report gives the reason. Meta appears to have removed a meaningful number of accounts across Facebook and Instagram in the weeks before the report, and those removals cut the ad reach figures that feed the global total. Meta also reported a brief dip in daily users in the first quarter of 2026, which it put down to internet disruptions in Iran and restrictions on WhatsApp in Russia. DataReportal expects the global adoption rate to pass 70% early in 2027 unless more purges arrive.
For a marketer the slowdown changes little. Nearly everyone who can be reached through social media already is, and the extra users now come mostly from developing economies where adoption is still rising. The fight is no longer for new users; it is for the time and attention of people who already use five or six platforms. That is why the time spent and favorite platform numbers further down matter more than the headline count.
One trap to avoid: comparing the October 2025 figure with figures from earlier in 2025, such as the July 2025 Statshot that many sites still quote. DataReportal revised its China numbers in late 2025, and the October 2025 report explains that the apparent jump came from that revision rather than from real growth. The growth rates above already account for it. If a page shows a sudden leap of several hundred million users in 2025, it is probably mixing the two series.
Longer term the curve is flattening the way internet adoption did a decade earlier. In October 2015 there were 2.27 billion identities, 30.3% of the world. Since then the total has grown by about 3.5 billion, an average of more than 28 million new identities a month across the decade according to the October 2025 report. The monthly average in the latest year is closer to 12.6 million (derived: 151 million ÷ 12).
Video: How DataReportal Builds Its Social Media Numbers
Simon Kemp, who writes the reports most social media statistics pages quote, walks through a 2024 edition. The numbers are older than the ones on this page; the method is the same.
How Many People Use Social Media Daily?
There is no worldwide daily count, but company figures get close. Meta's third quarter 2026 release, dated October 21, 2026, reports 3.64 billion daily active people across Facebook, Instagram, WhatsApp, Messenger and Threads, on average for September 2026, up 3% year over year. Three months earlier the second quarter release reported 3.60 billion for June. Because Meta counts each person once across its apps, that is the largest daily social figure any company publishes.
Other companies add smaller daily counts on top. Snap reported 493 million daily active Snapchat users in the second quarter of 2026 and 971 million monthly users, so about half its monthly users open it every day (derived: 493 ÷ 971 = 51%). Reddit reported 130.3 million daily active uniques and 514.6 million weekly active uniques for the same quarter. YouTube does not publish daily users, but its press page says Shorts now averages over 200 billion daily views.
Survey data shows how habitual it is. In Pew Research Center's 2025 report on Americans' social media use, about half of US adults said they visit Facebook at least once a day and about half said the same of YouTube; 37% visit Facebook several times a day and 33% say that of YouTube. 24% use TikTok daily and 10% use X daily. Among younger adults the daily habit is stronger: roughly half of 18 to 29 year olds go on TikTok at least once a day.
So how many people use social media daily? At least 3.64 billion use a Meta app each day, and no other company comes close to that number on its own. If you need a worldwide daily estimate, say more than 3.6 billion, cite Meta's release, and note that it is a floor, since some daily users of TikTok, YouTube, Telegram and WeChat never open a Meta app.
Social Media Users by Platform: The 11 Networks Spreadcast Posts To
The newest number each company has published, with the type of count it is. These are not comparable to each other; the next section explains why.
| Network | Latest published figure | What it counts | Source and date |
|---|---|---|---|
| 3 billion | Monthly active users | Mark Zuckerberg, September 24, 2025, via CNBC | |
| More than 3 billion | Monthly actives of the Facebook app | Mark Zuckerberg, January 2025, quoted in the same CNBC report. Meta stopped giving per app counts each quarter in 2024. | |
| Threads | 500 million | Monthly active users | TechCrunch, June 16, 2026, reporting Meta's announcement. More on our Threads statistics page. |
| More than 1.4 billion | Registered members, not active users | LinkedIn pressroom, read October 28, 2026 | |
| 640 million | Monthly active users | Pinterest second quarter 2026 results, August 4, 2026 | |
| TikTok | 2.2 billion | Ad reach, users 18 and above, India excluded | TikTok's ad tools, reported in DataReportal's April 2026 update |
| YouTube | Over 200 billion daily Shorts views | Views, not people. YouTube does not publish a user count. | YouTube press page, read October 28, 2026 |
| Bluesky | 41.41 million | Accounts, including those on independent servers | Bluesky 2025 Transparency Report, end of 2025. More on our Bluesky statistics page. |
| Mastodon | 744,878 active of 10,500,773 accounts | Monthly active users and total accounts on 7,266 servers | Mastodon statistics feed, reading of October 27, 2026 |
| Telegram | More than 1 billion | Monthly active users | Pavel Durov, March 19, 2025, via TechCrunch |
| Discord | Over 90 million | People and communities chatting every day, in Discord's own words | Discord company page, read October 28, 2026 |
Meta does not publish separate quarterly counts for Facebook, Instagram, WhatsApp or Threads; the per app numbers above are milestone announcements by Meta's chief executive. The family total of 3.64 billion daily people in September 2026 is the figure Meta reports every quarter.
Users on the Other Big Social Platforms
Five platforms Spreadcast does not post to, included because no social media statistics page is complete without them.
| Platform | Latest published figure | What it counts | Source and date |
|---|---|---|---|
| More than 3 billion | Monthly active users | Mark Zuckerberg on Meta's April 2025 earnings call, via TechCrunch | |
| Messenger | 37.9% | Share of online adults who used it in the past month | GWI, in DataReportal, Digital 2027. Messenger's ad reach fell by more than 95% after Meta dropped the inbox ad placement. |
| Snapchat | 493 million daily, 971 million monthly | Daily and monthly active users | Snap second quarter 2026 results, August 3, 2026 |
| 130.3 million daily, 514.6 million weekly | Daily and weekly active uniques, logged in and logged out | Reddit second quarter 2026 results, July 30, 2026 | |
| X | 450 million | Ad reach in X's own planning tools | DataReportal, April 2026 update, down from 611 million in April 2024 |
Reddit counts people who are not logged in: 77.7 million of its 130.3 million daily uniques were logged out in the second quarter of 2026, about 60% (derived). Reddit threads are read by far more people than the ones who post in them.
Why Platform User Numbers Never Line Up
Put the two tables side by side and they look like a league table. They are not. Each company picks the measure that flatters it and defines it in its own way, so a straight ranking by these numbers compares apples with weather reports.
Monthly active users count anyone who opened the app once in 30 days. Daily active users count a 24 hour period and are always smaller. Snap counts only logged in users; Reddit counts logged out visitors too. Pinterest counts an authenticated user who visits its site or app or uses its browser extension, measured on the last day of the quarter. LinkedIn reports members, which includes every account ever opened and not closed, so its 1.4 billion should never be set beside a monthly active figure. Pew's survey found that 31% of US adults use LinkedIn, a reminder of how far a member count sits from use.
Ad reach is the slipperiest. It is the audience a platform's ad tool says you could target, and the April 2026 update shows how far it can drift. TikTok's tools reported an adult ad reach of 2.21 billion outside India, against 1.44 billion for Instagram on the same basis, yet Instagram's monthly user count is higher and survey data puts more people on Instagram. TikTok's adult reach exceeded the entire adult population in 35 countries; in Saudi Arabia it was 164% of adults. DataReportal stresses that other platforms show the same overrun, just less of it.
Then there are counts that are not people at all. YouTube reports views. Mastodon's feed counts accounts on the servers it tracks. Bluesky's count includes accounts on independent servers in its network. Discord's company page describes friends and communities chatting each day without a formal definition. None of these is wrong, they just answer different questions.
The practical rule: when you compare platforms, use one source that measures all of them the same way. GWI's survey share, Similarweb's app panel and Pew's US survey each do that, and the next table puts the first two side by side. Use the company numbers to show a platform's scale and trend over time, never to rank it against another company's number.
Most Used Social Media Platforms, Measured Three Ways
Each column uses one method for every platform, so you can read across a row. GWI asks people; Similarweb watches app use on phones. All from DataReportal, Digital 2027.
| Platform | Used in past month (GWI, online adults 16+) | App monthly users index (Similarweb, Aug 2026) | Total app time index (Similarweb, Aug 2026) |
|---|---|---|---|
| 58.1% | 81.9 | 61.9 | |
| 56.6% | 77.9 | 96.2 | |
| YouTube | 56.2% | 96.2 | 100 |
| 54.9% | 100 | 96.3 | |
| Messenger | 37.9% | Not in top five | Not in top five |
| TikTok | Not in top five | 72.0 | 79.8 |
Similarweb's indexes give the top platform a score of 100 and leave out China and web use. No other platform scored above 10 on total app time in August 2026, which shows how concentrated attention is.
Favorite Social Media Platforms Worldwide
Use and preference are different things, and GWI asks about both. In its second quarter 2026 survey, reported in Digital 2027, Instagram was named the favorite platform by 17.8% of active social media users aged 16 and above, ahead of WhatsApp at 17.1%, Facebook at 13.3%, WeChat at 11.2% and TikTok at 10.0%. Those five take more than 60% of all votes. More than 99% of WeChat's votes come from mainland China.
The direction matters more than the ranking. Instagram's share of favorite votes rose from 16.7% a year earlier to 17.8%, a relative gain of 6.6%. TikTok rose from 9.1% to 10.0%, a relative gain of 9.9%. WhatsApp and Facebook lost share, and WeChat had the largest fall, from 11.7% to 11.2%. If you are deciding where a new brand account should live first, a platform that is gaining affection is a safer bet than one coasting on its size.
Among each platform's own users the picture shifts again. 43.8% of adult WeChat users call it their favorite, 38.4% of Douyin users say the same, then Instagram at 30.5%, WhatsApp at 30.2% and TikTok at 26.9%. Instagram ranks high on both measures, which is rare: large and loved. One more detail that surprises people: the same report notes that men make up 52.5% of Instagram's reported ad audience, and younger men are more likely than younger women to name Instagram as their favorite.
For a brand choosing networks, our longer comparison of Instagram, Pinterest and LinkedIn for app promotion turns these numbers into a choice by audience and post type.
Social Media Usage: How Much Time People Spend Each Day
GWI's latest survey, reported in Digital 2027, puts the time the typical online adult spends on social media and online video platforms at 19 hours and 18 minutes a week, 42 minutes more than a year earlier and a rise of 3.8%. That works out to about 2 hours and 45 minutes a day (derived: 19.3 hours ÷ 7). A year earlier the October 2025 report gave 18 hours and 36 minutes a week, and noted that the typical online adult spends roughly 16% of waking hours scrolling social and video feeds.
The weekly total splits into two parts that add up exactly. Scrolling social media feeds takes 7 hours and 13 minutes a week, the same time people spend playing video games. Watching online video takes 12 hours and 5 minutes, more than the 9 hours and 58 minutes spent on all forms of TV, including streaming. 92.1% of online adults watch online video each week, against 86.1% who watch any TV at all.
Age changes everything. Internet users aged 16 to 24 spend well over 24 hours a week on social and video feeds, which is more than 3 hours and 25 minutes a day (derived: 24 ÷ 7). That is over three times the time spent by users aged 65 and above. In the October 2025 data, women aged 16 to 24 averaged 25 hours and 45 minutes a week, more than 3 hours and 40 minutes a day.
Country changes it too. The typical internet user in the Philippines spends more than 36 hours a week on social and video feeds, roughly two full waking days. Social media time tops 24 hours a week in 12 countries. The United States, the United Kingdom and much of the European Union sit below the global average for social media use, while developing economies sit above it.
One caution if you compare years: GWI changed the questions it asks about time spent, so DataReportal no longer shows a complete timeline. Use the 2026 and 2025 figures above as a pair, and do not line them up against daily averages from older editions that still circulate on other pages.
Which App Gets the Most Time per User
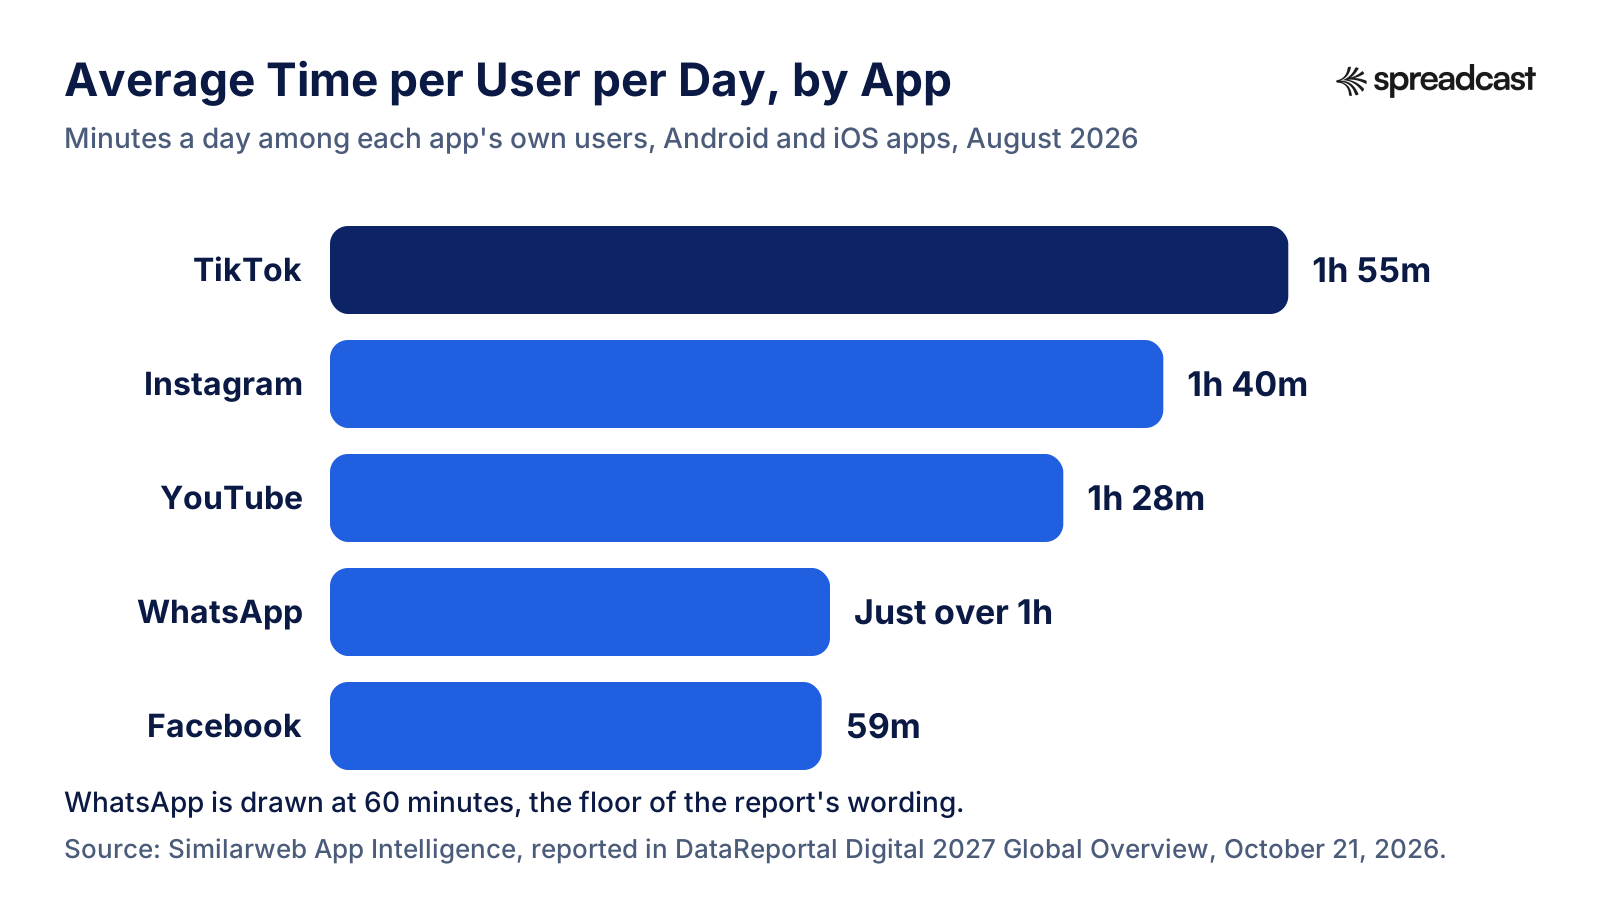
Average minutes a day among each app's own monthly users, from Similarweb's panel of Android and iOS phones.
Time per Session and Why It Matters for Posts
TikTok users spend the most time per day in the app, 1 hour and 55 minutes in August 2026, followed by Instagram at 1 hour 40 minutes and YouTube at 1 hour 28 minutes. Total time is a different ranking, because it multiplies time per user by the number of users: YouTube leads, with WhatsApp at 96.3% of YouTube's total and Instagram at 96.2%. The October 2025 report measured Android apps alone, with TikTok at 1 hour 37 minutes and Instagram at 1 hour 13 minutes, so do not read the change as growth; the 2026 figures include iPhones.
Session length is where the formats show. In August 2025, an average YouTube session on Android lasted 14 minutes and 29 seconds, about 50% longer than a TikTok session at 9 minutes and 42 seconds. Facebook sessions averaged 7 minutes and 17 seconds and Instagram sessions only 5 minutes and 56 seconds. Instagram visits are short, which is why a post there has to make its point in the first image.
That has a direct consequence for what you publish. A five minute Instagram visit spread across dozens of accounts gives your post a second or two. A designed image with one clear line beats a raw screenshot with a paragraph on it, and a carousel earns extra seconds only if the first slide pulls. Our breakdown of what makes a social creative convert covers the design side, and the social media image sizes and character limits pages cover the specs for each network.
Social Media Use in the United States in 2026
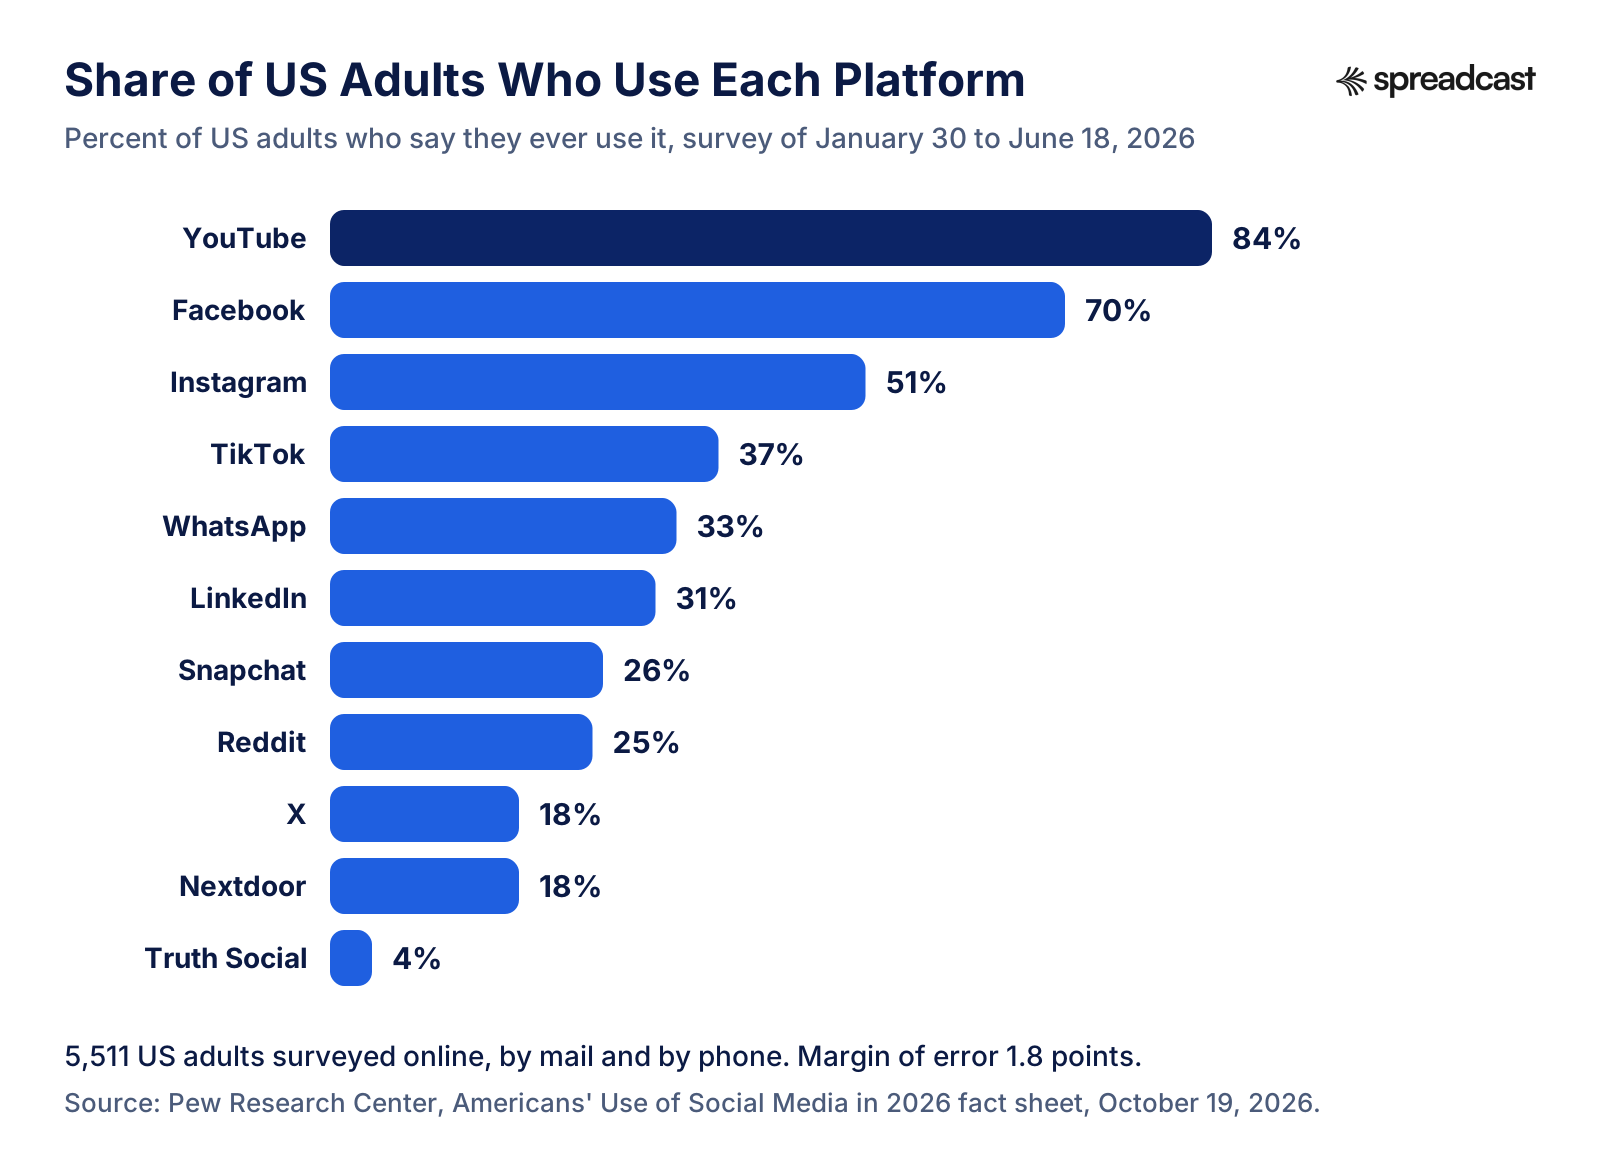
Pew Research Center's 2026 survey of 5,511 adults, the most careful measure of US platform use there is.
How Many Americans Use Social Media, Platform by Platform
YouTube and Facebook remain the most used platforms in the United States. Pew's 2026 fact sheet finds 84% of US adults use YouTube, 70% use Facebook and 51% use Instagram, the only three platforms used by half of adults or more. Then come TikTok at 37%, WhatsApp at 33%, LinkedIn at 31%, Snapchat at 26%, Reddit at 25%, X at 18%, Nextdoor at 18% and Truth Social at 4%. The survey reached 5,511 adults online, by mail and by phone, with a margin of error of 1.8 percentage points.
The trend over five years favors four platforms. In Pew's 2025 report, TikTok had risen from 21% of adults in 2021, Instagram from 40%, WhatsApp from 23% and Reddit from 18%. YouTube and Facebook have stayed roughly flat at the top. That report also asked about three newer platforms for the first time, Threads, Bluesky and Truth Social, and found each used by about one in ten US adults or fewer.
Compare the 2026 row with the 2024 row in Pew's own table and the moves are small: YouTube 85% to 84%, Instagram 50% to 51%, TikTok 33% to 37%, while X went from 21% to 18%. Year to year differences of one or two points are inside the margin of error, so treat them as flat.
Social Media Use by Age in the US
Share of US adults in each age group who say they ever use each platform, from the Pew Research Center survey of January 30 to June 18, 2026.
| Platform | Ages 18 to 29 | 30 to 49 | 50 to 64 | 65 and older |
|---|---|---|---|---|
| YouTube | 95% | 91% | 85% | 65% |
| 69% | 78% | 71% | 59% | |
| 79% | 64% | 41% | 21% | |
| TikTok | 65% | 45% | 31% | 11% |
| 37% | 39% | 36% | 20% | |
| 41% | 37% | 32% | 13% | |
| Snapchat | 56% | 33% | 13% | 4% |
| 40% | 35% | 18% | 6% | |
| X | 31% | 20% | 17% | 7% |
| Nextdoor | 10% | 21% | 19% | 18% |
Facebook is the only platform whose peak is not the youngest group: 30 to 49 year olds use it most. Instagram is used by nearly four times as many 18 to 29 year olds as adults 65 and older (79% vs 21%).
Social Media Use by Gender and Background
Women use more of the big visual platforms. In Pew's 2026 survey, 77% of women use Facebook against 63% of men, 56% use Instagram against 45%, 43% use TikTok against 31%, and 30% use Snapchat against 21%. Men lead on X (23% vs 14%) and Reddit (27% vs 23%). YouTube, WhatsApp and LinkedIn are close to even.
Race and ethnicity shift the mix. Hispanic and Black adults use TikTok far more than White adults (53% and 51% vs 30%), and WhatsApp use reaches 56% among Hispanic adults against 24% among White adults. Asian adults, in Pew's English speaking sample, stand out on LinkedIn at 54% and Reddit at 43%. Instagram use ranges from 46% of White adults to 69% of Asian adults.
Education shows up most on Reddit. The 2025 report found about four in ten adults with a college degree use it, against 28% of those with some college and 15% of those with a high school diploma or less. TikTok runs the other way, used more by adults without a degree. If your product sells to graduates and professionals, Reddit and LinkedIn deserve more weight than their headline totals suggest; our guide to promoting an app on Reddit covers how to do that without getting banned.
Teens and Social Media: Pew's Latest Numbers
Pew's December 2025 teen survey of 1,458 US teens aged 13 to 17 found YouTube used by roughly nine in ten, and TikTok and Instagram each by about six in ten or more. Roughly one in five teens say they are on TikTok and on YouTube almost constantly. Girls use Snapchat more than boys (61% vs 49%); boys use Reddit (21% vs 12%) and YouTube (94% vs 89%) more.
Facebook's slide with teens is the clearest long run change in the data. About three in ten teens use it today, against 71% in Pew's 2014 to 2015 survey, though the share is on par with 2022. The other big platforms have held steady among teens for several years.
The same survey adds a 2025 twist: 64% of teens say they use AI chatbots, about three in ten of them daily. Social feeds are no longer the only screen habit competing for a teenager's evening, which is one more reason brands aimed at young audiences need short, visual posts that work in a few seconds.
Social Media as a News Source
Social media is now where most Americans meet the news at least some of the time. Pew's news fact sheet says 59% of US adults get news from social media at least sometimes, from a survey of August 24 to 30, 2026: 26% often and 33% sometimes. In 2025 the same question gave 53% (21% often, 32% sometimes), and in 2022 it gave 50%. Only 23% now say they never get news there.
Sprout Social's first quarter 2026 Pulse Survey of 2,250 social media users in the US, UK and Australia found social media has overtaken TV as the main channel for discovering breaking news. The same survey shows the cost of that role: 88% said AI video tools have eroded their trust in news on social media, 56% see low quality AI content often or very often in their feeds, and 66% are more selective about what they engage with than a year ago. Even so, 65% said their trust in social media overall stayed the same or rose.
Brand crises play out there too. Sprout's second quarter 2026 survey, released June 18, 2026, found social media is the first place consumers hear about a brand controversy, ahead of news articles, friends and the brand itself. 64% want brands to respond publicly on social rather than through a press release, and 84% say response speed shapes their view of the crisis.
Video: How Young Adults Get Their News
A short explainer from the Pew Research Center on the age group that leans hardest on social feeds for news.

Social Media as a Search Engine and Brand Discovery Channel
People do not just scroll social media; they search it. GWI's second quarter 2026 data in Digital 2027 shows 41.8% of online adults use social networks when researching a purchase, second only to search engines at 45.3% and ahead of brand websites at 32.9% and AI tools at 26.0%. Among internet users aged 16 to 24, social networks are the first choice, used by 46.9% for brand research. Users aged 65 and above are more than four times as likely to use a search engine as social media for the same job.
For discovering new brands in the first place, the top three channels are almost tied: search engines at 32.0%, TV ads at 30.6% and social media ads at 30.4%. AI only just makes the top 15 at 17.0%, though it gained a full percentage point in three months. The typical online adult now uses 5.82 channels to find new brands, more than 4% more than two years earlier, which is the strongest case in the data against putting all your effort into one channel.
Sprout's second quarter survey adds what people search for on social: restaurants and things to do lead at 38%, with product reviews, travel ideas and news each at 30%. YouTube is the only platform in the top three search platforms for every generation from Gen Z to Baby Boomers. If your posts carry the words people type, such as the product category and the problem it solves, they can be found weeks after the feed has moved on.
Where Online Adults Discover and Research Brands
GWI's second quarter 2026 survey of internet users aged 16 and above, as reported in DataReportal, Digital 2027. People could pick more than one answer.
| Channel | Share of online adults | Stage |
|---|---|---|
| Search engines | 32.0% | Discovering new brands |
| Ads on TV | 30.6% | Discovering new brands |
| Ads on social media | 30.4% | Discovering new brands |
| Ads on websites | 22% | Discovering new brands |
| AI tools | 17.0% | Discovering new brands |
| Search engines | 45.3% | Researching a purchase |
| Social networks | 41.8% | Researching a purchase |
| Product and brand websites | 32.9% | Researching a purchase |
| AI tools | 26.0% | Researching a purchase |
| Social networks, ages 16 to 24 only | 46.9% | Researching a purchase |
Respondents chose an average of 5.82 discovery channels and 3.8 research channels in the second quarter of 2026.
Social Media Advertising Statistics
Social media is now the largest single category of digital advertising in the United States. The IAB and PwC Internet Advertising Revenue Report for full year 2025, released April 16, 2026, puts US social media ad revenue at $117.7 billion, up 32.6% or $29 billion in a year, and 40.0% of all digital ad revenue. Search came second at $114.2 billion, up 11%. Total US digital ad revenue reached $294.6 billion, up 13.9%, in a year without an Olympics, a World Cup or a national election.
The IAB now calls creator advertising a core media channel: spend reached $37 billion in 2025 and is projected to reach $44 billion in 2026, a rise of about 19% (derived: 44 ÷ 37). It also reports digital video at $78 billion, up 25.4%, much of it on social platforms.
Meta's results show where the money goes and what it costs. In the third quarter of 2026 Meta reported revenue of $64.60 billion, up 26%, with ad impressions up 10% and the average price per ad up 14%. In the second quarter impressions rose 14% and price per ad 12%. When price per ad rises faster than impressions, every advertiser pays more for the same reach. That trend is the quiet argument for building organic reach you do not rent.
Pinterest, Snap and Reddit show the same pattern at smaller scale. Pinterest reported second quarter 2026 revenue of $1,180 million, up 18%, and its average revenue per user was $8.30 in the US and Canada against $0.23 in the rest of the world, a gap of about 36 times (derived). Snap reported $1,599 million, up 19%. Reddit reported $805 million, up 61%, its eighth straight quarter above 60% growth.
Reach is shifting between platforms too. TikTok's own tools reported an adult ad reach above 2 billion in April 2026, up more than 8% in three months, according to DataReportal's mid year update. X's planning tools went the other way, from 611 million in April 2024 to 450 million in April 2026, a fall of about 26% (derived: 450 ÷ 611). And consumers notice the ads themselves: Hootsuite's Social Media Trends 2026 cites eMarketer research that nearly a third of consumers are less likely to choose a brand that uses AI ads.
Social Media Ad Revenue and Ad Metrics by Company
The latest quarter each company had reported on October 28, 2026. Revenue is total company revenue, which for all four is mostly advertising.
| Company | Quarter | Revenue | Change year over year | Source |
|---|---|---|---|---|
| Meta | Third quarter 2026 | $64.60 billion | +26%; impressions +10%, price per ad +14% | Meta release, October 21, 2026 |
| Second quarter 2026 | $1,180 million | +18% | Pinterest release, August 4, 2026 | |
| Snap | Second quarter 2026 | $1,599 million | +19% | Snap release, August 3, 2026 |
| Second quarter 2026 | $805 million | +61% | Reddit release, July 30, 2026 | |
| All US social media advertising | Full year 2025 | $117.7 billion | +32.6% | IAB and PwC, April 16, 2026 |
Meta guided fourth quarter 2026 revenue to $73 to $76 billion in the same release. Pinterest, Snap and Reddit publish third quarter results in the coming weeks.
Social Media Marketing Statistics for Business
The biggest change in how businesses make social content is AI. HubSpot's State of Marketing 2026 reports that 80% of marketers use AI for content creation and 75% use it for media production, and that 61% believe marketing is going through its biggest disruption in 20 years because of AI. The same report argues that audiences reward content that feels human and helpful, which sounds like a contradiction until you look at what consumers say they dislike.
They dislike sloppy AI, not tools. In Sprout's first quarter survey, the most common thing consumers want brands to stop doing in 2026 is posting AI generated content without labeling it, and 50% of Gen Z have already blocked, muted or unfollowed a brand or creator because their content felt like AI slop. The bar for business posts has moved: it is no longer enough to post often, the post has to look like the brand made it on purpose.
How many networks should a business be on? DataReportal's author gives an unusually direct answer in Digital 2027: set an objective for each social activity, pick the one or two platforms that serve it best, and avoid trying to be active everywhere, because returns fall off beyond three or four platforms. He also says not to ignore smaller platforms when they reach the audience you care about more cheaply. For most small brands that means two or three main networks plus the smaller ones where your audience already gathers, such as a Telegram channel or a Bluesky account.
The hard part is rarely choosing networks; it is keeping them fed. A small team posting three times a week to four networks needs twelve posts, each resized, recaptioned and scheduled. That is where most brand accounts go quiet. Spreadcast is built for that gap: you describe a post in one line or let it pick up your app's latest release, it designs the image in your brand and writes a caption for each network, then publishes to all of them after one tap of approval. The pricing page shows what each plan includes.
For budgeting, our startup marketing budget page shows where social content sits beside paid acquisition, and the real cost of designing posts by hand puts hours and freelance rates on the work. If you are weighing a person for the job, hiring a social media manager compares four options with prices.
Social Media Marketing ROI Statistics: What Can Be Measured
Search for social media marketing ROI statistics and you will find confident single numbers, often a percentage of marketers who say social works or a return per dollar. We could not find one that traces back to a public method with a sample and a date, so we do not repeat any here. Return on social depends on what you sell, where your buyers are and how long they take to buy, and a universal figure hides all three.
What the public data does support is narrower, and it is more useful. Paid reach is getting more expensive: Meta's price per ad rose 14% in the third quarter of 2026 while impressions rose 10% (Meta). Social is a top three discovery channel and a top two research channel for online adults (GWI in Digital 2027). And the money keeps moving toward social, with US social ad revenue up 32.6% in 2025 (IAB). Together those say that organic posting pays back when it is consistent enough to compound, and that paid social is a cost you should measure per result, not per impression.
To measure your own return, start with the numbers each platform gives you for free: followers, interactions and reach per network, then likes, comments, reach and views per post. Our guide to social media KPIs lists twenty with formulas, and the engagement rate calculator does the arithmetic for every network. Add a tagged link to every post so the traffic shows up in your analytics; for apps, the App Store campaign link generator builds those links in bulk.
Spreadcast's Analytics tab shows followers and interactions per network and likes, comments, reach and views per post for everything it publishes, so the weekly numbers are already in one place instead of eleven dashboards. Analytics come with publishing, which starts with Pro or a one time pass.
Instagram and Facebook Statistics
Instagram reached 3 billion monthly active users, Mark Zuckerberg said on September 24, 2025, as reported by CNBC. It was Meta's first Instagram user number since October 2022, when the app passed 2 billion. Facebook passed 3 billion monthly actives earlier in 2025, according to Zuckerberg's January remarks quoted in the same article. Meta said in April 2024 it would stop disclosing monthly and daily users per app, so these milestone remarks are the only per app numbers available.
Third party data gives the shape behind the totals. GWI finds 58.1% of online adults used Facebook in the past month and 56.6% used Instagram (Digital 2027). Instagram users spend 1 hour 40 minutes a day in the app against 59 minutes for Facebook users, so Instagram now earns far more attention per user even though Facebook's reach is a little larger. In the US, 70% of adults use Facebook and 51% use Instagram (Pew), and Instagram's audience is much younger.
For brands, the two apps reward different posts. Instagram rewards a strong first image or the first second of a Reel, and carousels that teach something. Facebook still reaches older and local audiences well, and 30 to 49 year olds are its biggest users in the US. Our guide on how to promote an app on Instagram covers formats in detail.
TikTok and YouTube Statistics
TikTok does not publish a global monthly user count. The closest public figure is its own ad tools, which reported a global reach of 2.2 billion users aged 18 and above in April 2026, with no data reported for India, where the app is banned (DataReportal). As explained above, that figure runs ahead of survey data. TikTok leads on engagement depth instead: 1 hour 55 minutes a day per user, the highest of any app, and 37% of US adults use it, up from 21% in 2021 (Pew).
YouTube's press page says Shorts averages over 200 billion daily views and that YouTube has been number one in US streaming watch time for nearly three years, citing Nielsen as of January 2026. It captured the largest share of total social app time worldwide in August 2026, and 84% of US adults use it, the highest of any platform in Pew's survey. In Sprout Social's second quarter survey it was also the only platform in the top three search tools for every generation.
The two now compete for the same short video viewer, and a vertical video can run on both with little change. If you are building a short video habit for a product, our guide on how to promote an app on TikTok covers what works in the first three seconds.
Video: Five YouTube Trends From YouTube's Own Report
YouTube's channel, with creators Colin and Samir, on the trends from its 2025 Culture and Trends report that it expects to shape 2026.

LinkedIn and Pinterest Statistics
LinkedIn's pressroom lists a community of more than 1.4 billion members, with LinkedIn used by nearly every Fortune 500 company. Members are accounts, not active users, and LinkedIn does not publish a monthly active figure. Pew's survey gives the usage view: 31% of US adults use LinkedIn, rising to 41% of 18 to 29 year olds and 54% of Asian American adults in its English speaking sample (Pew). For business to business products it remains the network where buyers expect to see a company post, and our LinkedIn post generator page covers formats that work there.
Pinterest reported 640 million monthly active users in the second quarter of 2026, a record and up 11% year over year, its eleventh straight quarter of double digit user growth. The growth is outside North America: 106 million users in the US and Canada (up 4%), 157 million in Europe (up 8%) and 377 million in the rest of the world (up 15%). Pinterest behaves more like a search engine than a feed, with pins found months after they go up, which makes it a long tail traffic source for products with a visual angle. Our guide to Pinterest for app founders covers sizes and pin SEO.
Threads, Bluesky and Mastodon Statistics
Threads reached 500 million monthly active users, Meta announced on June 16, 2026, as reported by TechCrunch; it had passed 400 million in August 2025. The full timeline, daily users and comparisons with X are on our Threads statistics page.
Bluesky grew nearly 60% in 2025, from 25.94 million to 41.41 million users, according to its 2025 Transparency Report; users created 1.41 billion posts that year. The count includes accounts hosted on independent servers across its network. Monthly figures and activity are on our Bluesky statistics page.
Mastodon is smaller and steadier. The statistics feed published by Mastodon's own site showed 10,500,773 accounts, 744,878 monthly active users and 7,266 servers on October 27, 2026; about 7% of accounts are active in a given month (derived: 744,878 ÷ 10,500,773). Its audience skews toward technical and open source communities, where a small, engaged following can matter more than reach.
All three are text first networks with short limits and image support, and many scheduling tools cover only some of them. Spreadcast publishes the same designed post to Threads, Bluesky and Mastodon alongside Instagram and LinkedIn, with a caption written to each network's limit; see how to schedule Bluesky posts and how to schedule Threads posts for the manual routes as well.
Telegram and Discord Statistics
Telegram passed 1 billion monthly active users, founder Pavel Durov said on March 19, 2025, up from 950 million the year before, as reported by TechCrunch. He also said the company made $547 million in profit in 2024. Telegram is a messenger, but its public channels work like a broadcast feed: one account posts, subscribers read, and there is no algorithm deciding who sees what. For a brand with an engaged community that is rare, guaranteed reach.
Discord's company page describes it as the place where over 90 million friends and communities chat over text, voice and video every day. The page gives no monthly user figure, and we did not find one published by Discord itself. Its value for a brand is a server where your most engaged users talk to each other, with an announcements channel you control.
Both are easy to neglect because they sit outside the usual scheduling workflow. Spreadcast posts to a Telegram channel and a Discord server from the same calendar as Instagram and LinkedIn, so the community gets the release note the same hour the feed does. Our guides on growing a Telegram channel and scheduling Telegram channel posts cover the native options too.
Social Media Facts Worth Knowing in 2026
Ten facts with a source behind each one, for the reader who wants the surprising bits.
Seven in Ten Humans Use Social Media
5.81 billion user identities in October 2026 equal 69.9% of the world's population, per DataReportal.
Online Video Beats TV on Time
Online adults watch 12 hours 5 minutes of online video a week against 9 hours 58 minutes of all TV, per GWI in Digital 2027.
Social Feeds Equal Gaming Time
The 7 hours 13 minutes a week spent scrolling social feeds matches the time online adults spend playing video games.
Meta Reaches 3.64 Billion Daily
That is the September 2026 average of people using at least one Meta app each day, per Meta.
Instagram Is the Favorite
17.8% of social media users aged 16 and above name Instagram their favorite platform, up from 16.7% a year earlier.
Facebook Lost the Teens
About three in ten US teens use Facebook, against 71% in 2014 to 2015, per Pew.
Most of Reddit Is Logged Out
About 60% of Reddit's 130.3 million daily uniques were logged out in the second quarter of 2026 (derived from Reddit's release).
Social Ads Passed Search
US social media ad revenue reached $117.7 billion in 2025, ahead of search at $114.2 billion, per the IAB.
News Lives on Social
59% of US adults get news from social media at least sometimes, up from 53% a year earlier, per Pew.
Japan Is the Outlier
Japan is the only country in GWI's survey where fewer than 90% of online adults used a social or messaging platform last month.
How to Post Every Week on Several Networks Without a Designer
Every number on this page points the same way. People spend close to three hours a day on social and video apps, they use more platforms than ever to find and check brands, and the posts that win attention look designed and on brand rather than thrown together. For a small team, that adds up to a workload nobody planned for.
Here is what a normal week looks like by hand for a small app or product team posting three times to four networks. Someone writes the idea, opens a design tool, finds the brand colors and the latest screenshot, makes a square version for Instagram, a portrait one for Pinterest and a wide one for LinkedIn, writes four captions to four different character limits, logs in to four schedulers or one scheduler with four connections, and checks each network's analytics separately on Friday. It is hours of work every week, and it is the first task dropped when a release is late.
Here is the same week with Spreadcast. You paste your App Store link, or your website if you have no app, and it builds a brand kit from it: icon, colors and real screenshots in an iPhone frame. It checks your App Store listing every day, and when a new version goes live or you hit a ratings milestone it designs the post, writes a caption for each network and publishes it, on full autopilot or after one tap of approval. For anything else you type one line in Create, or pick one of twelve post types for apps such as a feature, a how to or a testimonial, and it designs a single image or a carousel in your brand. You can upload your own pictures and video to schedule as well.
It publishes to Instagram, Facebook, Threads, LinkedIn, Pinterest, TikTok, YouTube, Bluesky, Mastodon, Telegram and Discord from one calendar, with drafts, approval and analytics. If you work in Claude or ChatGPT, the Spreadcast MCP server lets the assistant design posts and carousels, write captions, schedule and approve them, and read your analytics from the chat; our guide to Claude for social media shows that flow.
Pricing is simple. Free is $0 for one app and makes three posts to download, with a small Spreadcast mark and no publishing. Pro is $29 a month or $290 a year for clean posts with no cap, publishing to 10 social accounts across any mix of networks, autopilot or one tap approval and posting from Claude or ChatGPT. Studio is $79 a month for 5 apps and 50 accounts, each with its own brand. If you would rather not subscribe, a Post Pack is $19 once for 10 posts designed and published, and a 30 Day Pass is $39 once for everything in Pro for 30 days. Paid plans have a 7 day full refund. Details are on the pricing page.
If you want to plan before you automate, the social media content calendar template and the guide to batching a month of content in one afternoon work with or without any tool. For a wider look at the options, see our roundup of social media automation tools and the guide on how to automate social media posts.
Methodology: Where Social Media Sources Disagree
The places where two credible sources give different answers, and which one we use on this page.
| Question | Source A | Source B | Which to quote |
|---|---|---|---|
| How many people use social media | 5.81 billion user identities (DataReportal, October 2026) | 5.95 billion people, survey based estimate (DataReportal, April 2026) | The identities figure, with the word identities. It is the published headline and is updated twice a year. |
| Growth over the past year | +151 million, +2.7% (to October 2026) | +294 million, +5.4% (to April 2026) | The October 2026 figure, noting that Meta account removals lowered it. |
| Time spent per day | About 2 hours 45 minutes, social and online video together (GWI, derived from 19h 18m a week) | Daily averages from older editions, still widely quoted | The GWI 2026 figure. GWI changed its questions, so older figures are not comparable. |
| TikTok vs Instagram size | TikTok adult ad reach 2.21 billion outside India (TikTok's tools) | Instagram 3 billion monthly users (Meta) and higher survey use (GWI) | Do not rank them on these. Use GWI or Similarweb, which measure both the same way. |
| LinkedIn users | More than 1.4 billion members (LinkedIn) | 31% of US adults use it (Pew) | Members for scale, Pew for actual use. Never call members monthly users. |
| Bluesky users | 41.41 million accounts at the end of 2025 (Bluesky) | Live counters and app panels give other figures | Bluesky's own report for the total, and see our Bluesky page for activity. |
| Most used platform in the US | YouTube, 84% (Pew 2026) | Facebook, 58.1% worldwide (GWI) | Both are right for their scope: YouTube in the US, Facebook in GWI's global sample. |
| Social ad spend | $117.7 billion, US only, 2025 (IAB) | Global forecasts from paid research firms | The IAB figure for the US. We did not find a free global figure with a published method. |
Checked on October 28, 2026. When a newer edition of any source appears, its figure replaces the one here and this table is updated.
How to Cite These Social Media Statistics
Quote the original publisher, not this page and not the roundup where you first saw the number. Each figure here links to the report, release or fact sheet it comes from, and that is the link to put in your deck or article. Add the period the number covers, because a social media statistic without a date is how two year old figures end up in 2026 reports.
Keep the type of count in the sentence. Write that Pinterest had 640 million monthly active users in the second quarter of 2026, not that 640 million people use Pinterest. Write that LinkedIn has more than 1.4 billion members, not users. If you calculate something, say so and show the sum, the way the derived figures on this page do.
If you are building an audit of your own accounts, our social media audit template gives a checklist that starts from your own numbers rather than industry averages, and our guide to brand consistency without a design team covers the visual side most audits skip.
Frequently Asked Questions
How many people use social media in 2026?
About 5.81 billion social media user identities were active in October 2026, equal to 69.9% of the world's population, according to DataReportal's Digital 2027 report. Identities are not always unique people, but a survey based check by the same publisher in April 2026 landed at 5.95 billion people, within 3%.
How many people use social media daily?
Meta reports 3.64 billion people using at least one of its apps every day, the average for September 2026 in its third quarter release. No worldwide daily figure covers every platform, so treat that as a floor. Snapchat adds 493 million daily users and Reddit 130.3 million daily uniques, with overlap.
What percentage of the world uses social media?
69.9% of the world's population in October 2026, by DataReportal's count of user identities. As a share of internet users the figure is about 94% (derived: 5.81 billion ÷ 6.15 billion), and GWI's survey finds 97.1% of online adults used a social network or messenger in the past month.
What is the most used social media platform?
It depends on the measure. In GWI's worldwide survey Facebook leads with 58.1% of online adults using it monthly. By app users on phones, WhatsApp leads, with YouTube close behind. By total app time, YouTube leads. In the United States, YouTube is used by 84% of adults, the highest in Pew's 2026 survey.
How much time does the average person spend on social media per day?
About 2 hours and 45 minutes a day on social media and online video combined, derived from GWI's 19 hours and 18 minutes a week. Scrolling social feeds alone is 7 hours and 13 minutes a week, roughly an hour a day. People aged 16 to 24 spend more than 3 hours and 25 minutes a day.
How many Americans use social media?
Pew's 2026 survey finds 84% of US adults use YouTube, 70% Facebook and 51% Instagram, with TikTok at 37%. Pew reports use platform by platform, so quote the platform you mean.
How much do businesses spend on social media advertising?
US advertisers spent $117.7 billion on social media in 2025, up 32.6% and 40% of all digital ad revenue, according to the IAB and PwC report released April 16, 2026. Meta alone reported $64.60 billion of revenue in the third quarter of 2026.
Is social media use still growing?
Yes, but more slowly. User identities grew 2.7% in the year to October 2026, down from 4.8% a year earlier, partly because Meta removed accounts. Time spent rose 3.8% in the same year, to 19 hours and 18 minutes a week.
Where These Facts Come From
Every outside number, rule and price on this page links to the page it was taken from.
- Digital 2027 Global Overview Report (October 21, 2026)DataReportal
- Digital 2026 Mid Year Global Update Report (April 22, 2026)DataReportal
- Digital 2026: two in three people on Earth now use social media (October 2025)DataReportal
- Meta reports third quarter 2026 results (October 21, 2026)Meta
- Meta reports second quarter 2026 results (July 29, 2026)Meta
- Instagram now has 3 billion monthly active users (September 24, 2025)CNBC
- WhatsApp now has more than 3 billion users a month (May 1, 2025)TechCrunch
- Threads reaches 500 million monthly users (June 16, 2026)TechCrunch
- Threads now has more than 400 million monthly active users (August 12, 2025)TechCrunch
- About LinkedIn: membership figuresLinkedIn
- Pinterest second quarter 2026 results (August 4, 2026)Pinterest
- Snap second quarter 2026 financial results (August 3, 2026)Snap Inc.
- Reddit second quarter 2026 results (July 30, 2026)Reddit
- YouTube press page: YouTube by the numbersYouTube
- Bluesky 2025 Transparency Report (January 29, 2026)Bluesky
- Mastodon server and user statistics feedMastodon
- Telegram founder says the app now has 1 billion users (March 19, 2025)TechCrunch
- Discord company pageDiscord
- Americans' use of social media in 2026 fact sheet (October 19, 2026)Pew Research Center
- Americans' social media use 2025 (November 20, 2025)Pew Research Center
- Teens, social media and AI chatbots 2025 (December 9, 2025)Pew Research Center
- Social media and news fact sheet (2026)Pew Research Center
- Internet Advertising Revenue Report, full year 2025 (April 16, 2026)IAB
- Q1 2026 Pulse Survey: social media is now the top source for breaking news (March 25, 2026)Sprout Social
- Q2 2026 Pulse Survey: social media is the primary channel for brand crisis response (June 18, 2026)Sprout Social
- State of Marketing 2026HubSpot
- Social Media Trends 2026Hootsuite
- Video: Top 10 Digital Trends, July 2024DataReportal
- Video: How do young adults get their news?Pew Research Center
- Video: Colin and Samir share the 5 trends shaping YouTube's futureYouTube
Researched and written by Spreadcast. Last checked on October 28, 2026.