What Is the LTV CAC Ratio?
The LTV CAC ratio divides the lifetime value of a customer (LTV) by the cost of acquiring that customer (CAC). If an average customer brings in $900 of gross profit over the time they stay, and you spent $300 in sales and marketing to win them, your ratio is 3, usually written 3:1 or LTV:CAC = 3. The same thing is sometimes searched the other way round as the CAC to LTV ratio, which is just the inverse: $300 ÷ $900 = 0.33. Most investors, finance teams and benchmark reports use LTV on top, so this page does too.
The meaning is simple. A ratio below 1 says every customer you buy loses money even before you pay rent or salaries. A ratio between 1 and about 3 says customers pay back what they cost but leave little to fund the rest of the company. A ratio well above 3 says acquisition is efficient, and possibly that you could afford to spend more to grow faster. The number is a summary of four things at once: price, margin, retention and acquisition cost. That is why it is useful, and also why it is easy to fool yourself with it.
The idea is old. Subscription businesses such as telecoms and magazines used customer lifetime value long before software, and Bill Gurley describes the same formula in his 2012 essay The Dangerous Seduction of the Lifetime Value Formula under its older name, SAC, for subscriber acquisition cost. What made the ratio a standard target for startups was David Skok's SaaS Metrics article on For Entrepreneurs, where he set the rule of thumb that LTV must be at least 3x greater than CAC. We cover where that 3 comes from, and when it does not apply, further down.
One warning before the numbers. LTV is a forecast and CAC is a fact. You know exactly what you spent last quarter; you only guess how long this quarter's customers will stay. Every benchmark below should be read with that in mind, and the safest habit is to report both a realized LTV (what customers have actually paid so far) and a predicted one, with the prediction's assumptions written next to it.
LTV CAC Ratio Benchmarks at a Glance
The reference points people quote most, each with the page it comes from. Read the third column before comparing two rows, because the definitions are not the same.
| Benchmark | Figure | Source, period and definition |
|---|---|---|
| Minimum healthy LTV:CAC for SaaS | At least 3:1 | David Skok, SaaS Metrics, For Entrepreneurs. LTV on gross margin, CAC as total sales and marketing cost divided by deals closed. |
| LTV:CAC of the best SaaS businesses | Above 3, sometimes as high as 7 or 8 | David Skok, SaaS Metrics 2.0, For Entrepreneurs |
| LTV:CAC range Shopify calls efficient | 3:1 to 5:1 | Shopify, customer acquisition cost guide, July 29, 2024. Above that range you may be underinvesting in growth. |
| Point where customers start to be profitable; when to invest | 1x CLTV / CAC; invest at 3x or more | Bessemer Venture Partners, Scaling to $100 Million, September 21, 2021. CLTV measured on gross margin. |
| CAC payback target for SaaS | Under 12 months; best 5 to 7 months | Skok, SaaS Metrics 2.0 |
| CAC payback targets by segment | SMB under 12, mid market under 18, enterprise under 24 months | Bessemer, Scaling to $100 Million, payback on gross margin adjusted ARR |
| New customer CAC ratio, median B2B SaaS | $2.00 of sales and marketing per $1.00 of new ARR | Benchmarkit 2025 B2B SaaS Benchmarks, 2024 data. Bottom quartile spends $2.82. |
| Blended CAC ratio, median B2B SaaS | $1.30 per $1.00 of new and expansion ARR | Benchmarkit 2026 B2B SaaS and AI Native Metrics |
| Median year one revenue per paying subscriber, apps | $23 globally; $11.22 Gaming to $35.64 Health & Fitness | RevenueCat State of Subscription Apps 2026, over 115,000 apps, 2025 data, realized LTV per payer |
| Apple Ads average cost per acquisition | $3.76 | SplitMetrics Apple Ads benchmarks, search results ads, 2025 data |
All pages were opened on October 28, 2026. Where a page shows no publish date, none is given here.
How We Researched This
We read every page in the source list on October 28, 2026, and quote only what those pages say. The SaaS guidelines come from the people who wrote them: David Skok's two articles on For Entrepreneurs, Bessemer Venture Partners' Scaling to $100 Million report, a16z's 16 Startup Metrics and Bill Gurley's essay on the limits of the formula. SaaS medians come from Benchmarkit's public 2025 and 2026 pages and the ChartMogul SaaS Retention Report. App figures come from the public web version of RevenueCat's State of Subscription Apps 2026, Apple's App Store Connect help pages and SplitMetrics' Apple Ads benchmarks. Ecommerce guidance comes from Shopify's own guides and Klaviyo's help center.
Anything we calculated is labeled as derived, with the arithmetic shown. The worked examples use round, made up numbers for a fictional business so the method is easy to follow; they are examples, not benchmarks, and we say so each time. We did not use survey numbers we could not trace to the publisher's own page, which is why you will not find the popular ecommerce CAC tables that circulate without a source.
One thing we could not find is a trustworthy public LTV:CAC benchmark by industry measured the same way across companies. The ratio depends on how each company defines LTV, which costs it loads into CAC and how far ahead it forecasts. So instead of a single industry table, this page gives you the inputs (retention, revenue per customer, acquisition cost, margin) from named sources and shows how to build the ratio yourself.
LTV CAC Ratio Formula
The ratio itself is one division: LTV:CAC = customer lifetime value ÷ customer acquisition cost. All the work is in the two inputs, so here they are one at a time.
Customer acquisition cost is everything you spent to win customers in a period divided by the number of new customers in that period. Skok writes it as CAC = total cost of sales and marketing ÷ number of deals closed. That total should include ad spend, the salaries and commissions of the people who sell and market, agency and freelancer fees, tools, events and content production. A16z's 16 Startup Metrics and most finance teams use the same fully loaded version. A CAC that counts only ad spend is called paid CAC or media CAC; it is useful for comparing campaigns but it is not the CAC in the ratio.
Customer lifetime value is the profit a customer generates over the whole relationship. The simplest version, close to Skok's (he multiplies average revenue by lifetime and subtracts the cost to serve the customer), is LTV = average revenue per customer per month × gross margin × average customer lifetime in months, where the lifetime is 1 ÷ monthly churn. A customer paying $50 a month at 80% gross margin with 2% monthly churn stays 50 months on average and is worth $50 × 0.8 × 50 = $2,000 of gross profit. A16z goes one step further and asks for contribution margin, which also subtracts the variable selling, support and operating costs of serving that customer, and for the present value of future profit rather than a plain sum.
Two smaller formulas sit next to the ratio and are worth computing every time. Customer profit is LTV minus CAC, the dollars a customer leaves behind after paying for their own acquisition. CAC payback in months is CAC ÷ (monthly revenue per customer × gross margin), the time it takes for a customer's margin to repay what they cost. The ratio tells you whether a customer is worth buying; payback tells you how long your cash is tied up while you find out.
Which LTV Formula to Use
Four common ways to measure lifetime value, from the most generous to the most conservative. The further down the table, the more honest the ratio.
| Version | Formula | When it fits |
|---|---|---|
| Revenue LTV | Average order value × purchases per year × years as a customer | Quick ecommerce estimates. Shopify's CLV guide gives this formula and notes that a 3:1 ratio on revenue means $3 of lifetime revenue per $1 of CAC, which is far from $3 of profit. |
| Gross margin LTV | Monthly revenue per customer × gross margin ÷ monthly churn | SaaS and subscription apps. This is the version behind Skok's 3:1 guideline and Bessemer's CLTV. |
| Contribution margin LTV | (Revenue minus all variable costs of serving the customer) × lifetime | Businesses with real cost per customer: shipping, payment fees, AI inference, support. Recommended by a16z. |
| Realized LTV | Actual cumulative revenue per customer from a cohort after 30, 90 or 365 days | Young products without enough history to trust a churn rate. RevenueCat's realized LTV chart and Apple's cohorts report work this way. |
Whichever version you pick, use the same one every month and write it next to the number, so nobody compares a revenue LTV with a margin LTV.
Where the 3:1 LTV CAC Rule Came From
The 3:1 target is usually traced to David Skok, a founder turned venture capitalist at Matrix Partners, who published two guidelines in his original SaaS Metrics article: LTV should be at least three times CAC, and a company should recover its CAC in less than 12 months. In his follow up, SaaS Metrics 2.0, he says he spent the following two years checking those guidelines against many SaaS businesses, that the best ones have a ratio higher than 3 and sometimes as high as 7 or 8, and that many of the best recover CAC in 5 to 7 months.
Skok does not present 3 as a law of nature. In the same article he stresses that these are only guidelines and that there are situations where it makes sense to break them, and he notes that many healthy SaaS companies miss them in the early days. The reasoning behind 3 is practical rather than mathematical. A customer who returns exactly what they cost (1:1) has paid for their own acquisition and nothing else. The company still has to pay for product development, general and administrative costs, and the customers who churn faster than average. A margin of roughly two extra units of value per unit of acquisition spend is what leaves room for all of that plus a profit.
Bessemer makes the same point from the other side. Its Scaling to $100 Million report says that only after 1x CLTV / CAC are customers profitable to a business, that if CAC exceeds CLTV you should not acquire incremental customers, and that Bessemer recommends investing in customer acquisition when CLTV / CAC is 3x or more, experimenting until you get there if it is much lower. Between 1 and 3 you are not losing money on each customer, but you may not be making enough on them to run the company.
So when someone asks what an LTV CAC ratio of 3:1 means, the honest answer is: each customer brings in three times what it cost to acquire them, measured as gross margin over their expected lifetime, which is enough to fund a normal software company's other costs. It is a sanity check for a business with subscription revenue and gross margins in the 70% to 80% range. It is not automatically the right target for a store with 40% margins or an app that earns most of its money in the first week.
David Skok on the SaaS Metrics Behind 3:1
The author of the 3:1 guideline walks through how CAC, churn and lifetime value interact, using data from his portfolio companies.

What Is a Good LTV CAC Ratio?
A good LTV CAC ratio is one that is above 3 when LTV is measured on gross margin, holds up when you recalculate it with only the customers you actually paid for, and comes with a payback period your cash can survive. All three conditions matter. A ratio of 4 built on revenue rather than margin, or on a churn rate from your best month, is not a good ratio; it is a hopeful one.
The upper end deserves as much attention as the lower one. Shopify's CAC guide says a ratio between 3:1 and 5:1 means your acquisition strategy is working efficiently, and that a ratio above that range can mean you are not investing enough in growth. That sounds strange until you picture it: a company with a 10:1 ratio is leaving customers on the table that it could buy profitably. If a competitor is willing to accept 4:1, it can outbid you for every ad slot and still make money.
There is one exception to that, and it matters for small companies. If your ratio is high because most customers arrive without paid spend (word of mouth, search, social posts, App Store browse), a high blended ratio is not a sign of underinvestment. It is a sign that the cheap channels are working. The fix is to measure paid CAC and blended CAC separately, which we cover in the section on channels.
Good LTV CAC Ratio: How to Read Your Number
A plain reading of each band, assuming LTV is measured on gross margin and CAC is fully loaded.
| Ratio | What it means | What to do |
|---|---|---|
| Below 1:1 | Each customer costs more than they will ever return. Growth makes losses bigger. | Stop scaling paid channels. Fix price, retention or the channel before spending more. |
| 1:1 to 2:1 | Customers repay their own acquisition but leave little for product, salaries and overhead. | Look for the cheapest channel and the most retained segment, and move spend there. |
| About 3:1 | The common minimum for a healthy subscription business, per Skok. | Check payback. If it is under 12 months, this is a ratio you can grow on. |
| 3:1 to 5:1 | Efficient acquisition by Shopify's definition. | Test raising spend in the best channel while watching marginal CAC. |
| Above 5:1 | Either a very strong product, a lot of free acquisition, or underinvestment. | Split paid and organic CAC. If paid alone is above 5, you can probably afford to buy more growth. |
Bands combine Skok's guideline, Bessemer's 1x profitability point and Shopify's 3:1 to 5:1 range, all linked above.
LTV CAC Ratio Benchmark for SaaS
SaaS is where the ratio was born and where the most public data exists, although almost none of it reports LTV:CAC directly. Benchmark surveys prefer the CAC ratio and CAC payback because both can be computed from the income statement without forecasting churn. Benchmarkit's 2025 B2B SaaS Performance Metrics page, built on 2024 data, defines the new customer CAC ratio as total sales and marketing expense divided by new customer ARR. The median company spent $2.00 to acquire $1.00 of new customer ARR, up 14% on the year before, and the bottom quartile spent $2.82.
That number converts into an LTV:CAC estimate once you add gross margin and retention. Derived example: if a company spends $2.00 to win $1.00 of annual recurring revenue, earns 80% gross margin on it and keeps customers for five years on average, the customer is worth $1.00 × 0.8 × 5 = $4.00 of gross profit for $2.00 of CAC, a ratio of 2:1. With a three year average life the same company sits at 1.2:1. Retention is the hidden lever in every SaaS ratio.
The 2026 update on Benchmarkit's AI native metrics page reports a blended CAC ratio of $1.30, which counts expansion revenue from existing customers as well as new logos, a median software gross margin of 80% and median gross revenue retention falling from 88% to 84%. The same page notes that 40% of net new ARR comes from expansion at the median. That shift is why blended and new customer figures now differ so much: a company that grows mostly by upselling existing accounts looks efficient on blended CAC even if winning a new customer has become expensive.
Retention, the input that decides LTV, depends heavily on who you sell to. The ChartMogul SaaS Retention Report, built on data from more than 2,100 SaaS businesses, found that the top quartile of companies with an average revenue per account over $500 a month kept more than 90% of revenue, while the top quartile under $50 a month kept only 60% to 70%. Only 2.7% of companies with an ARPA under $10 a month had net retention above 100%, against 41.1% of those above $500 a month. A low priced tool sold to consumers and small teams therefore needs a much lower CAC to reach the same ratio as an enterprise product.
If you run a small SaaS, that last point is the useful one. With a $20 a month plan and the churn ChartMogul describes for low ARPA products, LTV rarely reaches a few hundred dollars, which means paid acquisition through ads or salespeople is hard to make work at 3:1. Most small SaaS companies that grow profitably lean on channels with almost no marginal cost: content, search, product led referrals and social posts from the founder and the brand. Our guide to SaaS social media marketing covers what to post from your product updates, and founder led marketing covers the personal side.
CAC Payback Period Targets for SaaS
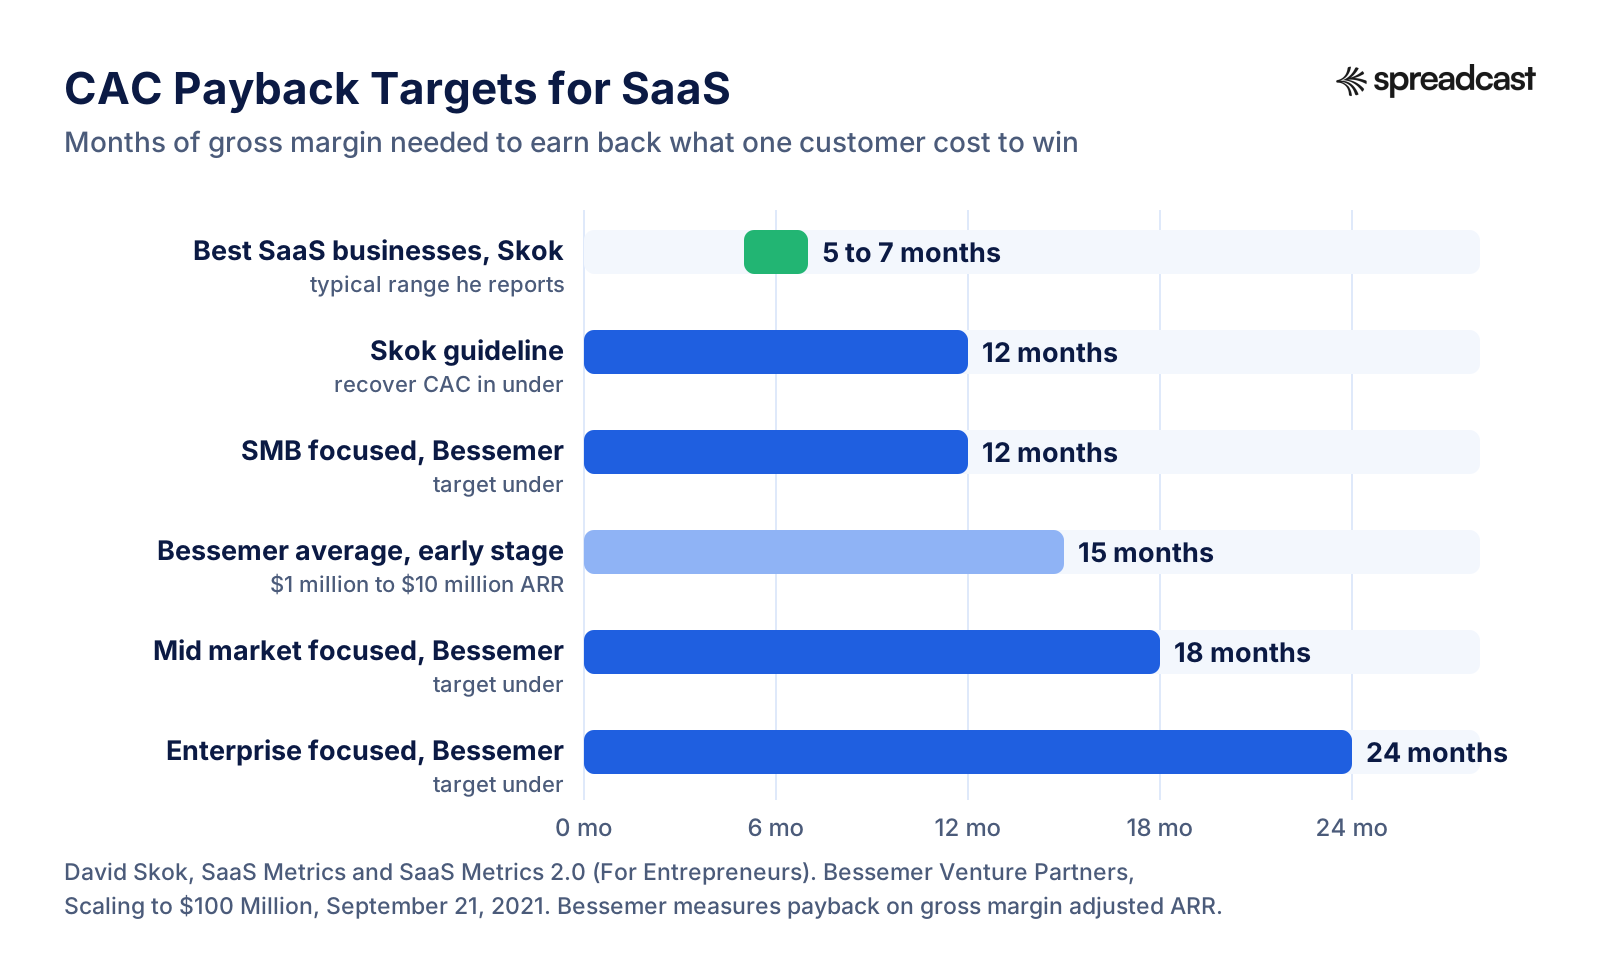
The payback guidelines investors use most, on one scale. Shorter is better; the right target depends on how long your customers stay.
CAC Payback Period: The Number to Check Next to the Ratio
CAC payback is the number of months a customer needs to pay back what you spent to acquire them, counting gross margin rather than revenue. The formula is CAC ÷ (monthly revenue per customer × gross margin). A customer who costs $600 to win and pays $50 a month at 80% margin pays you back in $600 ÷ $40 = 15 months.
Payback matters because the ratio ignores time. Two businesses can both show 3:1: one earns its LTV over 12 months, the other over 60. The first can reinvest its money five times while the second waits. Bessemer's report explains that it is only after you repay CAC that you generate profit on a customer, and that the average CAC payback in its $1 million to $10 million ARR bucket was 15 months, rising slowly as companies grow and early adopters run out. It suggests targets of under 12 months for SMB focused companies, under 18 for mid market and under 24 for enterprise, because enterprise customers stay longer and can support a longer wait.
Benchmarkit's 2025 page says the common wisdom of about 12 months is a fair starting point but that payback is highly correlated with contract value, and that its median CAC payback rose 12.5% between 2022 and 2024. Skok's own advice is stricter: under 12 months, with the best businesses at 5 to 7.
For a small company the rule of thumb is simpler. Payback has to be shorter than the time your bank balance can wait. If you have six months of cash, a channel with 15 month payback will grow your revenue and kill the company at the same time, however good its LTV:CAC looks on paper. That is the strongest argument for channels that pay back in weeks, or that cost almost nothing to begin with.
LTV CAC Ratio for Subscription Apps
Mobile subscription apps break most SaaS assumptions. Prices are lower, many plans are weekly, a large share of revenue arrives in the first days after install, and Apple or Google take a commission before you see anything. The best public dataset is RevenueCat's State of Subscription Apps 2026, which covers over 115,000 apps, more than $16 billion in revenue and 2025 as its main period.
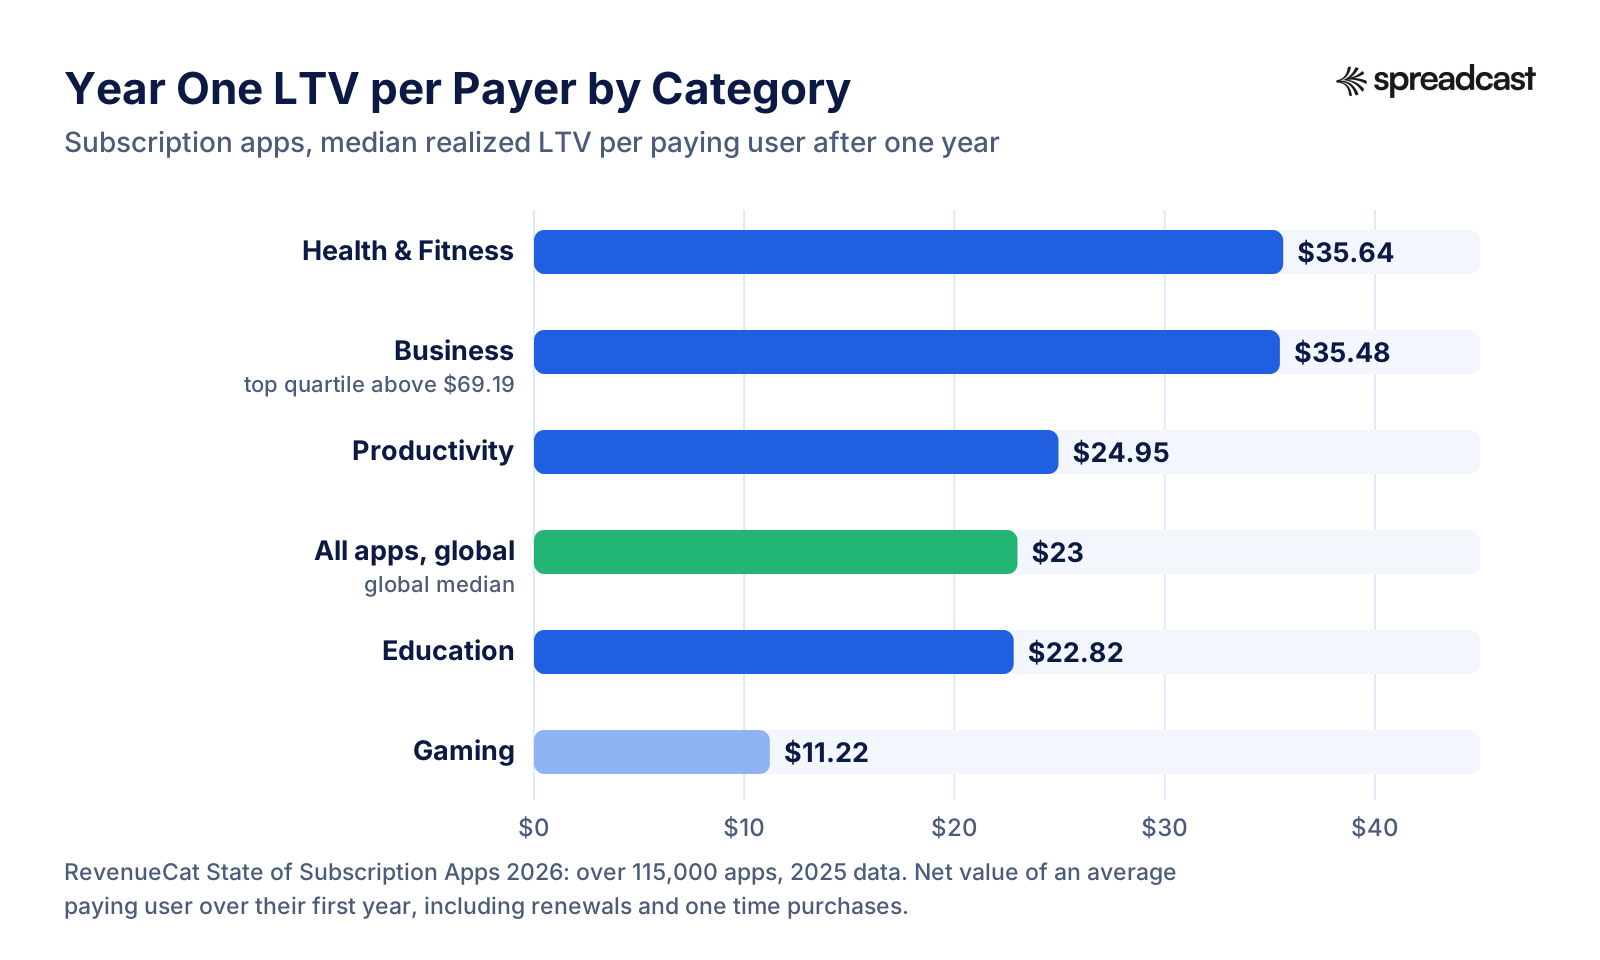
Its realized LTV per paying user after one year, the net value of an average payer over twelve months including renewals and one time purchases, had a global median of $23. By category the medians ran from $11.22 in Gaming to $24.95 in Productivity, $35.48 in Business and $35.64 in Health & Fitness, and the top quartile of Business apps passed $69.19. By developer location the median was $32 for North American developers, $25 for Western Europe and $14 for India and Southeast Asia.
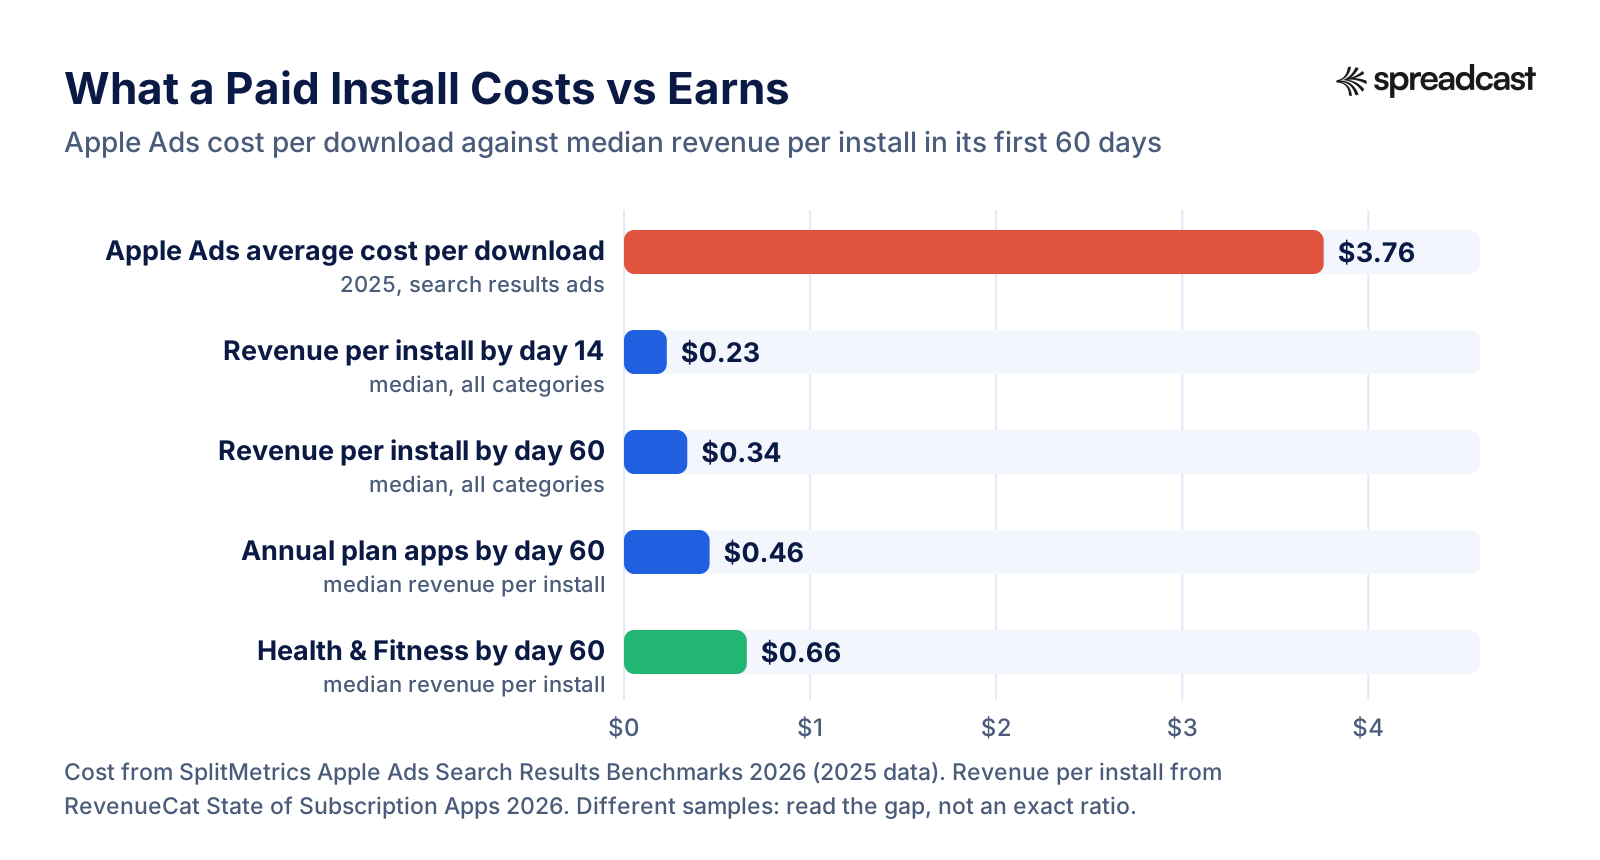
The report also measures value per install rather than per payer, which is the number that matters when you buy installs. Median revenue per install was $0.23 by day 14 and $0.34 by day 60 across all categories. Health & Fitness reached $0.48 by day 14 and $0.66 by day 60; Gaming reached $0.08 and $0.14. Only a small share of installs ever pay: the median download to paid conversion by day 35 was 2.0% globally, 2.9% in Health & Fitness and 1.0% in Gaming. Apps with a hard paywall converted 10.7% against 2.1% for freemium, although RevenueCat notes that after one year retention for the two models is nearly identical. Set those figures next to what installs cost by network, category and country on our cost per install benchmarks page.
Before you compare any of those figures with your own, subtract the store's share. Apple's App Store Small Business Program charges a reduced 15% commission on paid apps and in app purchases for developers with up to $1 million in proceeds in the prior calendar year. Google Play's service fee page lists 15% for auto renewing subscriptions in markets still on its older schedule, and a new regional structure that is being rolled out. Your LTV should be built on proceeds, the money that actually reaches you, then reduced again for any per user cost such as AI inference or servers.
Apple now gives you the realized version of app LTV without a third party tool. The Cohorts section of App Store Connect Analytics includes a Proceeds per Download metric, where each row is a cohort of users who downloaded the app in the same month and each column shows the average cumulative proceeds per download after D1, D2, D3 and so on. Read across a row and you have the realized LTV curve per install, net of Apple's commission, for that month's users.
Subscription App LTV by Category
Median realized lifetime value per paying user after one year. The spread between categories is bigger than most founders expect, and it sets how much you can pay for a subscriber.
The Numbers an App Needs for LTV:CAC
Every input in an app's ratio, the median from a named source, and where to find your own number. Use the median only until you have three months of your own cohorts.
| Input | Median benchmark | Where to find yours |
|---|---|---|
| Download to paid by day 35 | 2.0% global; 10.7% hard paywall vs 2.1% freemium (RevenueCat) | App Store Connect, Cohorts, Download to Paid (Apple) |
| Revenue per install by day 60 | $0.34 all categories; $0.66 Health & Fitness; $0.14 Gaming (RevenueCat) | App Store Connect, Cohorts, Proceeds per Download |
| Realized LTV per payer, year one | $23 global; $11.22 to $35.64 by category (RevenueCat) | RevenueCat or your billing tool's realized LTV chart (RevenueCat docs) |
| Annual plans still paid after 12 months | 30.7% for non AI apps, 21.1% for AI apps (RevenueCat) | App Store Connect, Cohorts, Subscription Retention |
| Refund rate in the first billing period | Most categories 3% to 4% (RevenueCat) | Your subscription analytics |
| Store commission | 15% for small developers (Apple); 15% on subscriptions on Google Play's older schedule (Google) | Your agreements and payout reports |
| Cost per install from ads | $3.76 average cost per acquisition on Apple Ads, 2025 (SplitMetrics) | Your ad accounts, divided by attributed installs |
RevenueCat figures are from the 2026 report's public web version, 2025 data. The AI app comparison is the report's own split.
What a Paid Install Costs vs What It Earns
The single picture that explains why most small apps cannot grow on paid installs alone. The red bar is the average price of one Apple Ads download; the others are what a median install earns.
Why Paid Installs Rarely Reach 3:1 for Small Apps
Put the two datasets side by side and the problem is plain. SplitMetrics reports an overall average Apple Ads cost per acquisition of $3.76 in 2025, with Sports at $19.74, Finance at $13.28 and Medical at $8.90 as the most expensive categories. RevenueCat's median install earns $0.34 in its first 60 days. Derived: on day 60 the median paid install has returned about 9% of its cost ($0.34 ÷ $3.76).
Payers tell the same story. At the global median of 2.0% download to paid, buying one paying subscriber through $3.76 installs costs about $188 ($3.76 ÷ 0.02). Against a median year one realized LTV of $23 per payer, that is a ratio near 0.12 in year one. Health & Fitness does better on both inputs, with 2.9% conversion and $35.64 of year one value, and still lands near 0.27 ($3.76 ÷ 0.029 = $129.66; $35.64 ÷ $129.66). These are derived figures from two different samples and should be read as orders of magnitude, not as anyone's actual result.
Three things push real apps above those numbers. Search ad users have high intent: SplitMetrics reports that 66.2% of taps on Apple Ads search results became downloads in 2025, which suggests they convert to paid better than the average install. Apps in the top quartile convert roughly twice as well as the median: the top quartile of Health & Fitness apps passes 6.2% download to paid, against a 2.9% median. And many apps earn for several years, not one. Even so, the gap between a median paid install and a median install's value is roughly tenfold, and no amount of bid tuning closes a tenfold gap.
That is why app founders who grow profitably usually start with organic installs, then add paid installs once their conversion and retention are well above the median. Our cost per install benchmarks page goes deeper on paid prices by country and category, app retention benchmarks covers the retention side, and how to get app downloads lists every source of installs with what each one costs.
Subscription App Benchmarks for Small Teams
RevenueCat's developer advocates read the 2026 report from the point of view of a solo developer or a small team, which is where most LTV:CAC decisions on paid installs are made.

LTV CAC Ratio for Ecommerce
Ecommerce is where the ratio is most often overstated, because the easiest LTV to compute is a revenue LTV. Shopify's customer lifetime value guide, updated October 8, 2026, gives the standard formula, CLV = average order value × annual purchase frequency × average customer lifespan in years, and is careful to add that with revenue based CLV a 3:1 ratio means $3 in lifetime revenue for every $1 spent acquiring a customer. Three dollars of revenue at a 40% gross margin is $1.20 of gross profit, which barely covers the dollar you spent.
Shopify's CAC guide shows the correction with a simple example: multiply CLV by your gross margin, so a $300 CLV at 40% margin is $120 of profit per customer, and if that profit is less than your CAC you are spending more on acquisition than customers return. For stores, go one step further and use contribution margin: subtract shipping you pay, payment processing, packaging, returns and discounts per order. Those costs scale with every order in a way software costs do not.
Worked example for a fictional store: average order $60, gross margin 45%, and $8 of shipping and payment cost per order. Each order contributes $60 × 0.45 minus $8 = $19. If the average customer places 2.4 orders over two years, contribution LTV is $45.60 while revenue LTV is $144. With a CAC of $38, the revenue ratio is a flattering 3.8:1 and the contribution ratio is 1.2:1. The second number is the one your bank account will agree with.
Stores also have a timing problem that subscriptions do not. A first order often loses money and repeat purchases make the profit, so LTV depends on how many customers come back and how fast. Klaviyo, which many Shopify stores use for email, will only show a predicted CLV on a profile once the account meets its predictive analytics conditions: at least 500 customers who have placed an order, at least 180 days of order history with orders in the last 30 days, and some customers with three or more orders. Its default prediction period is one year. If your store is younger than that, use realized 90 and 180 day value per customer and leave the lifetime forecast for later.
A Shopify survey quoted in the same CLV guide found that, in Q4 2025, 30% of store owners with more than $1 million in revenue said they track customer acquisition cost, against 5% of those under $100,000. Tracking CAC is not complicated, but most small stores do not do it, which is part of why so many grow sales while running out of cash.
LTV CAC Ratio Examples, Worked Through
Three fictional businesses with round numbers, so each step is easy to check. Replace the inputs with your own and the arithmetic stays the same.
- Step 1
Example 1: A B2B SaaS Plan at $49 a Month
The company spent $60,000 on sales and marketing last quarter, salaries included, and won 100 new customers, so CAC is $600. Customers pay $49 a month at 80% gross margin, which is $39.20 of margin per month. Monthly churn is 3%, so the average lifetime is 1 ÷ 0.03 = 33.3 months. LTV is $39.20 × 33.3 = $1,307. The ratio is $1,307 ÷ $600 = 2.2:1 and payback is $600 ÷ $39.20 = 15.3 months. If churn falls to 2%, lifetime becomes 50 months, LTV $1,960 and the ratio 3.3:1 with no change in marketing at all.
- Step 2
Example 2: A Subscription App With an Annual Plan
An annual plan costs $39.99. After Apple's 15% small business commission, proceeds are $33.99. Suppose 30% of subscribers renew into year two and half of those renew into year three; then the average subscriber pays 1 + 0.30 + 0.15 = 1.45 years, and LTV is $33.99 × 1.45 = $49.29 before server and AI costs. If 3% of installs subscribe and paid installs cost $3.76, one subscriber costs $3.76 ÷ 0.03 = $125.33 and the ratio is 0.39:1. If instead the app gets installs from organic posts and its store page at an all in cost of $0.50 per install, a subscriber costs $16.67 and the ratio becomes 3:1.
- Step 3
Example 3: An Online Store With Repeat Orders
Average order $60, 45% gross margin, $8 of shipping and payment cost per order, so each order contributes $19. Customers place 2.4 orders over two years: contribution LTV $45.60. Meta and Google ads bring customers at $38 each, a contribution ratio of 1.2:1. An email flow that lifts repeat orders to 3.0 per customer raises LTV to $57 and the ratio to 1.5:1; adding customers from free channels at a lower cost is what moves the blended number past 3.
- Step 4
Example 4: Reading the Same Business Two Ways
Take Example 1 and report it as revenue LTV instead: $49 × 33.3 months = $1,633, a ratio of 2.7:1. Now also load only ad spend into CAC (say $25,000 of the $60,000), so CAC drops to $250, and the same revenue LTV gives a ratio of 6.5:1. Nothing about the business changed between 2.2 and 6.5; only the definitions did. Always write the definition next to the number.
Blended vs Paid CAC: How Channels Change the Ratio
Blended CAC divides all acquisition spend by all new customers, including the ones who found you on their own. Paid CAC divides paid spend by the customers that spend actually brought in. Gurley's essay singles this out as one of the most common ways the formula gets abused: marketers divide spend by total customers rather than by the customers that were purchased, and if you have organic customers they should not be in the spend calculation because they would have arrived regardless. He also argues that organic customers usually outperform purchased ones on almost every metric, from conversion to churn.
Both numbers are useful, for different decisions. Paid CAC tells you whether to put the next dollar into ads. Blended CAC tells you whether the company as a whole acquires customers efficiently. A healthy business often has a paid ratio near 3 and a blended ratio well above it, because free channels carry part of the load. A business whose blended ratio looks great only because organic customers hide expensive ads is the one that gets surprised when it scales spend.
Here is how the mix moves the number for one fictional company with an LTV of $120 per customer. In month one it spends $10,000 on ads and wins 200 customers: paid CAC $50, ratio 2.4:1. In month two it keeps the ads and adds an organic program that costs $1,500 a month in tools and time and brings 300 more customers: blended CAC is $11,500 ÷ 500 = $23 and the blended ratio 5.2:1, while the paid ratio is still 2.4. In month three it halves the ads to $5,000 (100 customers) and keeps the organic program: $6,500 ÷ 400 customers = $16.25, a blended ratio of 7.4:1.
The point is not that ads are bad. It is that a cheap, steady organic channel lowers your blended CAC enough to make the paid channel affordable, and gives you a floor of customers in months when you cut paid spend. The cost of the organic channel still belongs in CAC: tools, the hours someone spends making posts, freelancers. A channel that is free in cash but eats 20 hours of a founder's week is not free.
If social media is your organic channel and the hours are the real cost, that is the part Spreadcast is built to remove. You paste your App Store link or website at /start, it builds your brand kit, designs on brand posts and carousels and publishes them to Instagram, Facebook, Threads, LinkedIn, Pinterest, TikTok, YouTube, Bluesky, Mastodon, Telegram and Discord. For an app it also watches the App Store listing and drafts a post when a new version or a ratings milestone goes live. The cost line in your CAC becomes a fixed subscription instead of a weekly design session.
Organic vs Paid Growth and Unit Economics
Y Combinator's Startup School lesson on consumer metrics separates organic from paid growth before it gets to unit economics, which is the right order for the ratio too.
Organic Social as a Near Zero CAC Channel
Organic social media is one of the few channels where the marginal cost of one more customer is close to zero once the system runs. You pay for the time or the tool that makes the posts, and every customer who arrives from them lowers CAC for everyone. Compare that with paid channels, where you set a price per result and pay it every time: Google Ads Target CPA bidding asks you to set the average cost per conversion you want, and for App campaigns that target is the same whether the conversion is an install or an in app action; Apple Ads Basic lets you pay only for installs at a maximum cost per install you choose; Apple Ads Advanced charges per tap, with your max CPT bid as the ceiling.
The catch is that organic social is hard to keep going and hard to measure. Most small accounts post in bursts, stop after a few weeks, and never learn which posts brought customers. Both problems have practical fixes.
To measure it, give every network its own tracked link. For an iPhone app, App Store Connect campaign links add a provider token and a campaign token to your App Store URL, and Analytics then shows impressions, product page views, downloads, sales and subscriptions per campaign. One link for Instagram, one for Threads, one for LinkedIn, and so on, and you have install and revenue numbers per network instead of a guess. Our free App Store campaign link generator builds them in bulk. For a website, UTM tagged links do the same job in your analytics tool.
To keep it going, lower the cost of each post. Scheduling tools help with timing but not with making the post: Buffer's Essentials plan was listed at $5 a month per channel on yearly billing on October 28, 2026, and Hootsuite's paid plans start at $99 per user per month for Standard. Neither designs the image for you. The real cost of organic social for a small team is the design and writing time, which our breakdown of the cost of designing social posts by hand puts in hours and dollars, and which a social media manager costs far more to cover.
This is where Spreadcast changes the CAC line. Instead of a designer, a scheduler and a freelancer, Pro costs $29 a month or $290 a year and includes clean posts with no cap, publishing to 10 social accounts across any mix of networks, autopilot or one tap approval, and posting from Claude or ChatGPT. If you want to test the channel before committing, the Post Pack is $19 once for 10 posts designed and published, and the 30 Day Pass is $39 once for everything in Pro for 30 days. Put that against the follower, interaction and reach numbers you track, check post quality with the engagement rate calculator, and you have an organic CAC you can actually calculate. Plans are on the pricing page.
LTV CAC Ratio Calculator: Build It in a Spreadsheet
You do not need a dedicated LTV CAC ratio calculator; ten cells in a spreadsheet do the job and, unlike a web form, they keep your assumptions visible. Put inputs in column B, label them in column A, and keep one tab per month so you can see the ratio move. The table below is the whole calculator.
Two rules make it trustworthy. First, fill the churn cell from a cohort that is at least a few months old, not from last month's cancellations alone, because new customers churn faster than old ones and one month is noisy. Second, add a second copy of the sheet for paid only: paid spend in B1 and paid customers in B2. The difference between the two ratios is the value of your free channels.
If you sell an app, you can skip the churn guess entirely and use realized value: take Proceeds per Download at day 90 or day 365 from App Store Connect cohorts, multiply by installs per paying user, and you have a realized LTV per payer that already includes Apple's commission. Divide by your cost per paying user and you have a realized ratio that nobody can argue with.
LTV CAC Ratio Calculator Template
Copy these rows into any spreadsheet. Inputs are in rows 1, 2, 4, 5 and 6; everything else is a formula.
| Cell | What goes in it | Formula or example |
|---|---|---|
| B1 | Sales and marketing spend this period, salaries, tools and ads included | Example: 60000 |
| B2 | New paying customers this period | Example: 100 |
| B3 | CAC | =B1/B2 |
| B4 | Average revenue per customer per month, after store fees or payment fees | Example: 49 |
| B5 | Gross margin as a decimal | Example: 0.8 |
| B6 | Monthly churn as a decimal, from a cohort at least three months old | Example: 0.03 |
| B7 | Average lifetime in months | =1/B6 |
| B8 | LTV on gross margin | =B4*B5*B7 |
| B9 | LTV:CAC ratio | =B8/B3 |
| B10 | CAC payback in months | =B3/(B4*B5) |
With the example inputs the sheet returns CAC $600, LTV $1,307, a ratio of 2.2 and payback of 15.3 months, the same as Example 1 above.
Common LTV CAC Ratio Mistakes
Each of these makes the ratio look better than the business is. Most teams make at least two.
Revenue Instead of Margin
Revenue LTV can be two or three times gross margin LTV. Bessemer, Skok and a16z all build LTV on margin; a16z goes further and calls revenue or gross margin LTV a common mistake, asking for net contribution.
Organic Customers in Paid CAC
Dividing ad spend by all new customers credits ads with people who came from word of mouth, search and social posts. Gurley calls this out directly. Split the two.
Ad Spend Only
Leaving out salaries, agencies, tools and content production can cut CAC in half on paper. If a person spends time acquiring customers, their cost belongs in CAC.
Forgetting the Store's Cut
For apps, LTV must be built on proceeds after Apple's or Google's commission, and for stores after payment fees, shipping and returns.
A Churn Rate From Your Best Month
One good month of low cancellations can double the lifetime in the formula. Use a cohort average and recheck it every quarter.
Forecasting Too Far Ahead
With only a few months of data, a lifetime of five years is a guess. A16z suggests measuring 12 month and 24 month LTV instead of predicting the whole curve.
Ignoring Payback
A 4:1 ratio that takes 30 months to pay back can still run a small company out of cash. Report the two together.
Assuming CAC Stays Flat as You Spend More
Gurley points out that the inputs pull against each other: spending more usually raises CAC and can bring in customers who churn faster. The next customer costs more than the average one.
How to Improve Your LTV to CAC Ratio
There are only two directions: make customers worth more, or make them cheaper to win. Small teams usually find the second easier in the short term and the first more durable.
On the LTV side, the strongest lever for subscription apps is plan length. RevenueCat's 2026 data shows annual plans generating roughly two times the revenue per install of monthly plans and about five times that of weekly plans, with median day 60 revenue per install of $0.46 for annual, $0.24 for monthly and $0.09 for weekly. Price is the next lever, then retention: in the SaaS example above, cutting churn from 3% to 2% lifted the ratio from 2.2 to 3.3 without a cent more in marketing. Reducing refunds and failed payments helps too. For stores, the lever is repeat orders: post purchase email, replenishment reminders and a reason to come back. Our retention benchmarks show what normal looks like by category.
On the CAC side, start with conversion, because every percentage point of conversion lowers the cost of each customer from every channel at once. For apps that means the product page: screenshots, the first lines of the description, ratings. Our guide to App Store conversion rate and the App Store optimization guide cover the store side, and how to get App Store reviews covers ratings. Then add channels with low marginal cost. How to promote an app for free ranks fourteen of them, and a launch moment such as Product Hunt can bring a burst of customers at almost no media cost.
Retention is cheaper to buy than acquisition. HBR's The Value of Keeping the Right Customers puts acquiring a new customer at five to 25 times the cost of retaining one, depending on the study and the industry, and cites Frederick Reichheld's Bain research that raising retention by 5% increases profits by 25% to 95%. Those are broad estimates rather than a benchmark for your business, but the direction is consistent with every dataset on this page.
The order matters for a small company. Fix conversion first, because it multiplies everything else. Build one free channel that runs every week without you. Only then buy customers, and buy them in the channel where paid CAC is lowest, with a hard ceiling set at a third of the LTV you can prove from realized cohorts.
For the free channel, the bottleneck is almost never ideas; it is producing a decent post every few days on every network. Spreadcast takes that job: one line in Create, or one of twelve post types for apps such as a testimonial, a how to or a feature, becomes a designed single image post or carousel in your brand, with a caption written for each network, scheduled on one calendar. You approve with one tap, or let new versions and ratings milestones publish on autopilot. If you already work in Claude or ChatGPT, the Spreadcast MCP server lets the assistant design, schedule and approve posts and read the analytics without leaving the chat.
LTV CAC Ratio for Startups Without Much Data
Most of the advice on this page assumes you have a year of customers. A new startup does not, and the ratio is easy to misuse in that situation. A few rules keep it useful.
Use realized value for the first year. Report what each monthly cohort has actually paid after 30, 90 and 180 days, the way App Store Connect cohorts and RevenueCat's realized LTV chart do, and compare that with what the cohort cost. If the 90 day realized value already covers CAC, you are in a strong position whatever the lifetime turns out to be.
Keep the first marketing budget small and channel by channel. Our startup marketing budget page lays out budgets line by line from $0 a month upward, and how to market an app gives a plan per stage. Run each paid test with a fixed budget and a CAC ceiling, and stop it when it misses the ceiling twice.
Count your own time. Founders often leave themselves out of CAC because they are not paid a salary yet. That hides the true cost of founder led sales and content, and it breaks the moment you hire someone to do the same job. Estimate the hours and put a price on them, even a low one. Indie app marketing covers how solo developers keep that time small, and an AI marketing agent can take part of the routine work if you set one up with an approval step.
Where Spreadcast Fits in Your LTV:CAC
Spreadcast is marketing automation for social media, built first for App Store apps. It sits in the cheapest part of your acquisition mix: the organic posts that bring people to your App Store page or website without a cost per click. Our page on mobile app marketing shows how it runs for an app week to week.
Here is the before. A founder or marketer opens a design tool, finds the brand colors, drops a screenshot into a phone mockup, writes a caption, rewrites it shorter for Threads and Bluesky, exports four sizes, logs into four schedulers or apps, and does it again three days later. That is two to four hours a week that never shows up in CAC, and it is why most small brand accounts go quiet within a month.
Here is the after. You paste your App Store link at /start, or your website or a short description if you have no app, and Spreadcast builds a brand kit from it: icon, colors and your real screenshots in an iPhone frame. It checks the listing daily; when a new version goes live or the app hits a ratings milestone, it designs the post, writes a caption for each network and publishes, on full autopilot or after one tap of approval. For anything else you start from one line in Create or a post type, and it designs single image posts and carousels in your brand. You can also upload your own pictures and video to schedule. Posts go to Instagram, Facebook, Threads, LinkedIn, Pinterest, TikTok, YouTube, Bluesky, Mastodon, Telegram and Discord, and Analytics shows followers and interactions per network plus likes, comments, reach and views per post.
For the ratio, that turns a variable, hard to count cost into a fixed one. The Free plan is $0 for one app and makes 3 posts to download with a small Spreadcast mark (no publishing). Pro is $29 a month or $290 a year and covers the whole organic social line for most small companies: clean posts with no cap and publishing to 10 social accounts. Studio is $79 a month for 5 apps and 50 accounts, each with its own brand, for studios and agencies. Paid plans have a 7 day full refund. Add tracked campaign links to the posts and you can divide that fixed cost by the installs and subscribers each network brings, which is exactly the organic CAC line your spreadsheet needs. See features for the full list, or start with your App Store link.
LTV CAC Terms in Plain Words
The abbreviations that appear around the ratio, so a board deck or investor email reads clearly.
| Term | Meaning |
|---|---|
| LTV, CLV or CLTV | Customer lifetime value: the profit (or revenue, if stated) a customer brings over the whole relationship. |
| CAC | Customer acquisition cost: sales and marketing spend divided by new customers in the same period. |
| SAC | Subscriber acquisition cost, the older name Gurley uses for CAC. |
| Paid CAC | Paid spend divided by the customers that paid spend brought in, excluding organic customers. |
| Blended CAC | All acquisition spend divided by all new customers, organic included. |
| CAC payback | Months of gross margin a customer needs to repay their CAC. |
| CAC ratio | Sales and marketing spend divided by new ARR. $2.00 means $2 spent per $1 of new annual revenue. |
| ARPA, ARPU | Average revenue per account or per user, usually monthly. |
| GRR, NRR | Gross and net revenue retention: revenue kept from existing customers before and after expansion. |
| RPI | Revenue per install, an app metric: total revenue divided by installs. |
| Proceeds | What Apple or Google pays you after their commission. |
Frequently Asked Questions
What is a good LTV CAC ratio?
About 3:1 or higher when LTV is measured on gross margin and CAC includes all sales and marketing costs. Shopify calls 3:1 to 5:1 efficient. Above 5:1 you may be underinvesting in growth, unless the high ratio comes from customers who arrive without paid spend.
What does an LTV CAC ratio of 3 to 1 mean?
Each customer brings in three times what it cost to acquire them over their expected lifetime. One unit pays back the acquisition, and the other two cover product, overhead and profit. The guideline comes from David Skok's SaaS Metrics articles.
How do you calculate the LTV to CAC ratio?
Divide customer lifetime value by customer acquisition cost. LTV is monthly revenue per customer times gross margin divided by monthly churn. CAC is total sales and marketing spend in a period divided by new customers in that period.
What is a good LTV CAC ratio for SaaS?
3:1 or better, with CAC payback under 12 months for products sold to small businesses. Bessemer suggests under 18 months for mid market and under 24 for enterprise, where customers stay longer.
What is a good LTV CAC ratio for ecommerce?
3:1 is the usual reference, but only if LTV is built on contribution margin after product cost, shipping and payment fees. A 3:1 ratio on revenue at a 40% margin barely breaks even.
Is a higher LTV to CAC ratio always better?
Not always. A very high ratio on paid channels can mean you are spending too little and letting competitors buy the customers you could win profitably. A very high blended ratio from organic channels is a good sign.
What is the difference between LTV CAC ratio and CAC payback?
The ratio says how much a customer returns over their whole life relative to their cost. Payback says how many months it takes to get the acquisition cost back. Two businesses with the same ratio can have very different payback periods.
How do you calculate LTV for a subscription app?
Use proceeds after Apple's or Google's commission. The simplest honest method is realized value: App Store Connect cohorts show proceeds per download after each day, and RevenueCat's realized LTV chart shows revenue per customer by cohort.
What is the CAC to LTV ratio?
It is the same comparison flipped: CAC divided by LTV. A CAC to LTV ratio of 0.33 equals an LTV to CAC ratio of 3:1. Most benchmarks use LTV on top.
Where These Facts Come From
Every outside number, rule and price on this page links to the page it was taken from.
- SaaS Metrics: a guide to measuring and improving what mattersDavid Skok, For Entrepreneurs
- SaaS Metrics 2.0: a guide to measuring and improving what mattersDavid Skok, For Entrepreneurs
- Scaling to $100 million (September 21, 2021)Bessemer Venture Partners
- 16 startup metricsAndreessen Horowitz
- The dangerous seduction of the lifetime value formula (September 4, 2012)Bill Gurley, Above the Crowd
- The value of keeping the right customers (October 29, 2014)Harvard Business Review
- 2025 B2B SaaS performance metrics benchmarksBenchmarkit
- 2026 B2B SaaS and AI native metricsBenchmarkit
- SaaS retention report (November 1, 2023)ChartMogul
- State of Subscription Apps 2026RevenueCat
- Realized LTV per customer chartRevenueCat Docs
- Cohorts: download to paid and proceeds per downloadApple Developer
- Campaign links in App Store Connect AnalyticsApple Developer
- App Store Small Business ProgramApple Developer
- Service feesGoogle Play Console Help
- Set and adjust bidsApple Ads
- Apple Ads Basic overviewApple Ads
- Apple Ads cost: CPA, CPT, CR and TTR benchmarks for 2026SplitMetrics
- About Target CPA biddingGoogle Ads Help
- Customer lifetime value guide (October 8, 2026)Shopify
- Customer acquisition cost guide (July 29, 2024)Shopify
- Understanding predictive analytics and CLVKlaviyo Help Center
- Buffer pricingBuffer
- Hootsuite plansHootsuite
- Video: David Skok on driving SaaS success using key metricsSaaStr AI
- Video: Consumer startup metrics, Startup SchoolY Combinator
- Video: The State of Subscription Apps 2026 for indie developersRevenueCat
Researched and written by Spreadcast. Last checked on October 28, 2026.