How Often Do Apps Update? The Short Answer
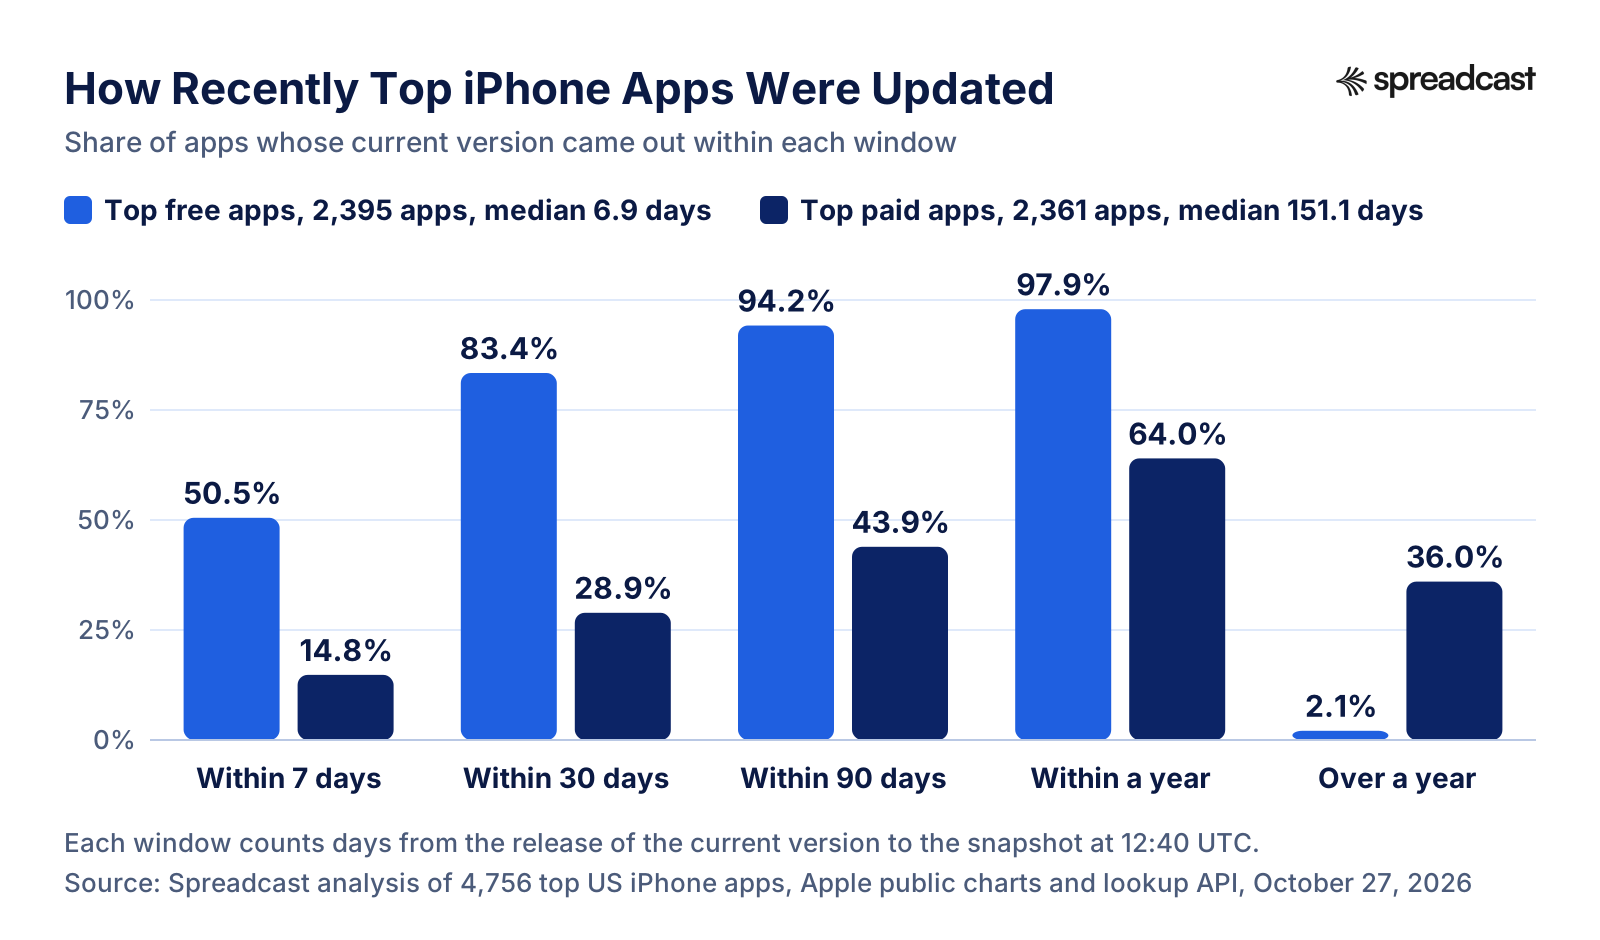
Popular iPhone apps update about once every week or two. On October 27, 2026, we looked up all 4,756 apps in Apple's US top free and top paid charts for 24 iPhone app categories and read the release date of each app's current version. The median top free app had shipped that version 6.9 days earlier. Half of the top free apps, 50.5%, had released a new version within the past 7 days, and 83.4% within the past 30.
Top paid apps update far less often. Their median was 151.1 days since the last update, and 36% had not shipped a new version in over a year. Part of the gap is what kind of app sits in each chart: the paid charts are full of small, long running apps, and the median top paid app had 40 ratings, against 51,733 for the median top free app. Size does not explain all of it, though. Among apps with 1,000 to 10,000 ratings, the median was 11.9 days in the free charts and 91.9 days in the paid charts.
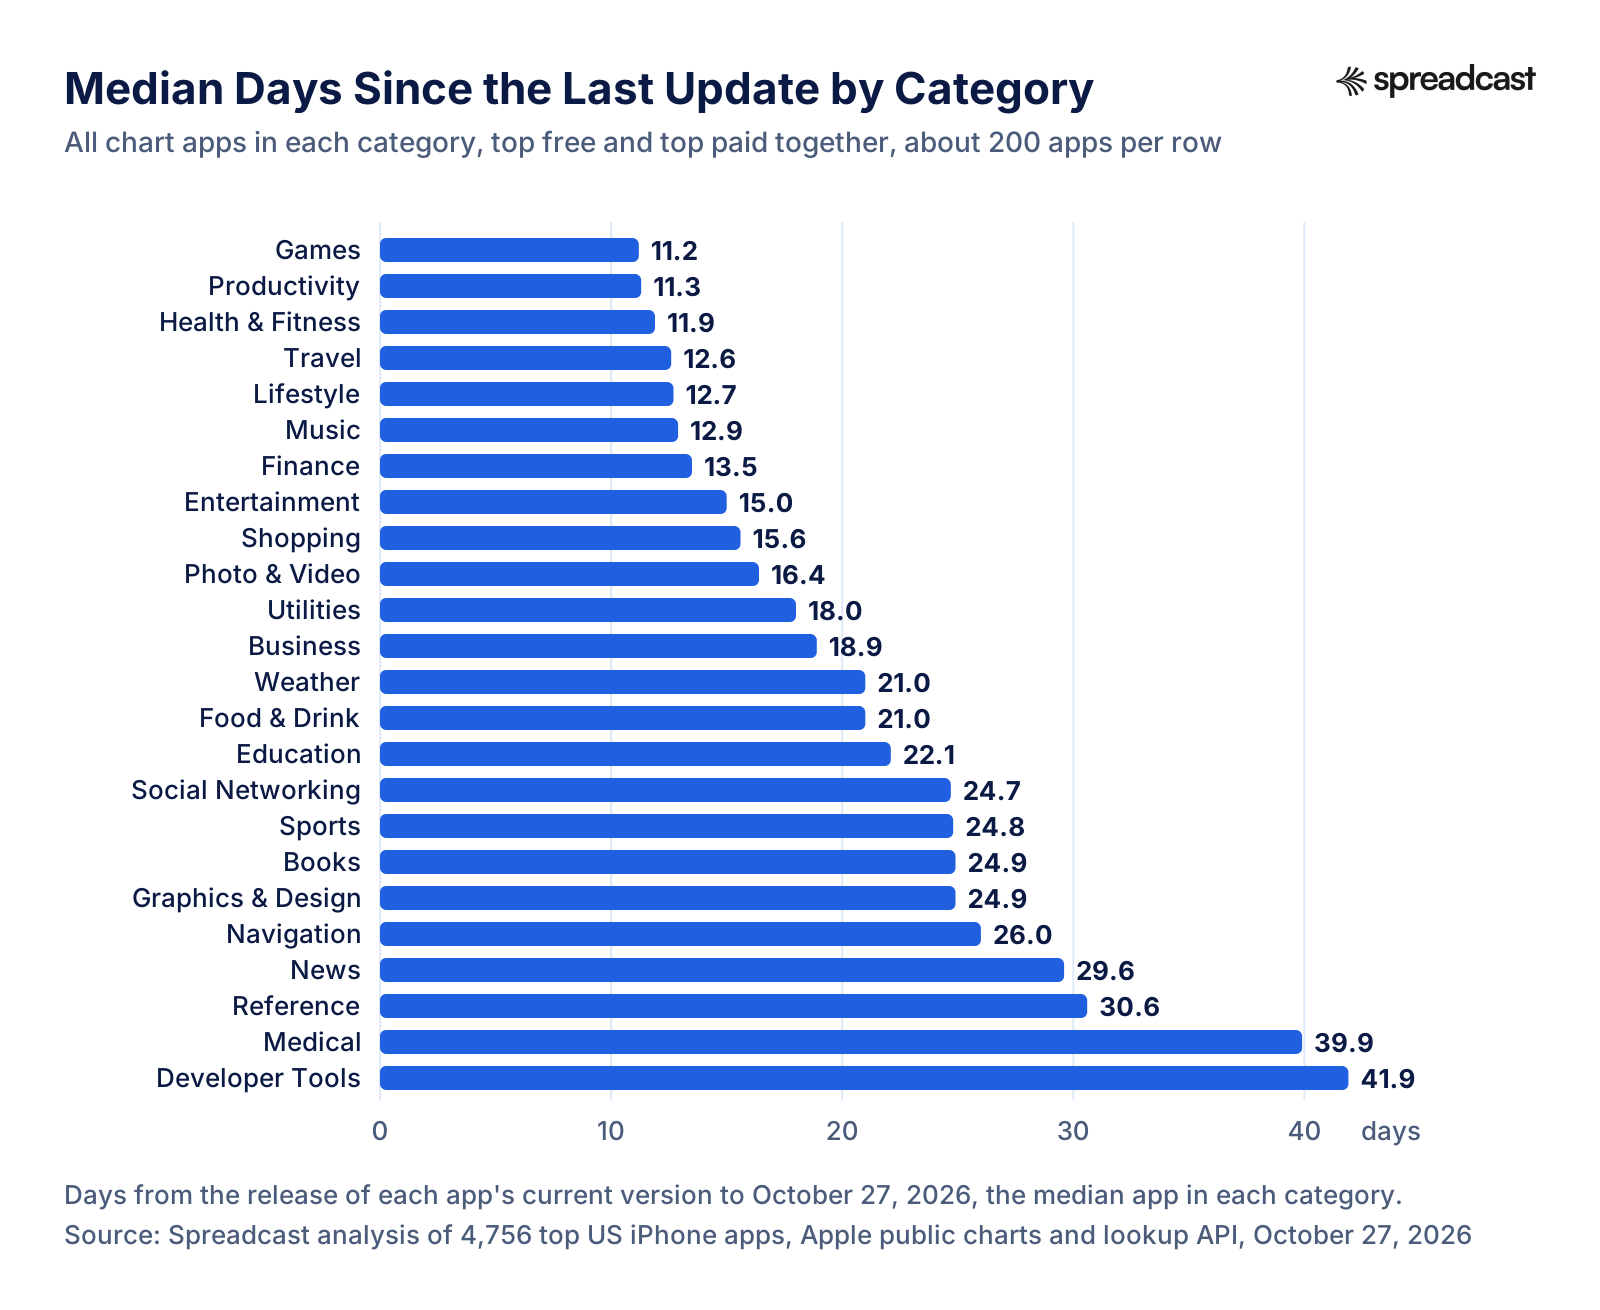
Size is the other big dividing line. Apps with a million ratings or more had a median of 4.9 days since their last update, and 96.6% had updated within 30 days. Apps with fewer than 1,000 ratings had a median of 99.8 days. Apps in the top 10 of their category had a median of 6.8 days. Across categories, the median ran from 11.2 days for Games to 41.9 days for Developer Tools, and Monday was the most common release day, with 23.2% of recent releases against 6.6% on Sunday.
Every number on this page comes from that one snapshot or from a source linked where it is used. The first sections answer the consumer questions about updates on an iPhone and explain the method. The later sections are for people who build apps: release cadence by category and app size, the best day to ship, what large teams do, and how to set up your own app release schedule. The aggregate tables can be downloaded at the end of the page.
Top Free vs Top Paid Apps: How Recently Each Was Updated
The two kinds of chart behave like two different markets. Almost every top free app shipped within the past three months, while more than a third of top paid apps had not shipped in a year.
What We Found in 4,756 Top iPhone Apps
The headline results, all from our October 27, 2026 snapshot of Apple's US iPhone charts. Days count from the release of each app's current version to the moment of the snapshot.
| Measure | Result | Group |
|---|---|---|
| Median days since the last update | 6.9 days | Top free apps, 2,395 apps |
| Updated within the last 7 days | 50.5% | Top free apps |
| Updated within the last 30 days | 83.4% | Top free apps |
| Median days since the last update | 151.1 days | Top paid apps, 2,361 apps |
| Not updated in over a year | 36.0% | Top paid apps |
| Median days since the last update | 6.8 days | Apps in a category top 10, 480 apps |
| Median days since the last update | 4.9 days | Apps with 1 million ratings or more, 268 apps |
| Updated within the last 30 days | 96.6% | Apps with 1 million ratings or more |
| Median days since the last update | 99.8 days | Apps with fewer than 1,000 ratings, 2,294 apps |
| Fastest and slowest category by median | Games 11.2 days, Developer Tools 41.9 days | All chart apps in each category, about 200 apps each |
| Share of recent releases on a Monday | 23.2% | 3,291 apps updated in the last 90 days, days in UTC |
| Share of recent releases on a Sunday | 6.6% | The same 3,291 apps |
| Release notes left empty | 3.5% | All 4,756 apps |
| Release notes that are only a stock phrase | 6.9% | 4,591 apps with notes, strict exact match |
| Median length of release notes | 104 characters | 4,591 apps with notes |
| Product page lists one language or none | 51.2% | All 4,756 apps |
| Median app size | 94 MB | All 4,756 apps |
All figures are our own calculation from Apple's public data, made by one script so they can be rerun. Percentages are rounded to one decimal place.
How Often Do Apps Update on iPhone?
If you own an iPhone and wonder why your apps keep changing, the short answer is that the people who make them ship new versions often, and your phone installs them for you. Apple's support page on updating apps, dated September 14, 2026, says apps you download from the App Store update automatically by default on iPhone and iPad. Apple's iPhone User Guide adds that the apps that come with your iPhone are updated whenever you update iOS.
How often do apps update automatically? Apple does not publish a schedule for automatic updates, and the Apple help pages we read do not say at what time of day they run. What sets the pace is how often each developer releases a version. In our snapshot, half of the top free apps had released one in the past week, and 12.1% in the past 24 hours. On that pace, a phone holding 40 popular free apps would see about 20 of them change in a typical week. That is a rough estimate from our data, not a figure Apple publishes.
Apple's own totals show how much of this happens without anyone noticing. The 2025 App Store Transparency Report counts 46,630,867,840 automatic app updates a week against 701,572,983 manual ones. Derived from those two figures, about 1.5% of updates were installed by hand.
Why are my apps updating so often? Mostly because large apps ship on a fixed weekly schedule, which the section on release trains below describes, and because quick fixes go out between those releases. If you prefer to decide yourself, you can turn automatic updates off: open Settings, tap Apps, tap App Store and turn off App Updates. Apple's support page says that with automatic updates off, the App Store sends you a notification each time an update for one of your apps is released. To update by hand, open the App Store, tap your account picture, tap App Updates, then tap Update next to an app or Update All. The App Store settings page of the same guide lists the related switches, including Cellular Data for downloads away from Wi Fi and Offload Unused Apps.
How We Measured App Update Frequency
We started from Apple's public top charts for the United States. For each of 24 iPhone app categories, we read the top 100 free apps and the top 100 paid apps from Apple's legacy iTunes RSS feeds, such as the top free Games feed. That made 48 charts. We left out Stickers, Catalogs and the old Newsstand category, which hold few or no regular apps. In our data, no app appeared in more than one chart.
We then looked up every app with Apple's public iTunes Lookup API, which returns the store record for an app ID. The lookups ran on October 27, 2026 and finished at 12:40 UTC. Some charts yielded fewer than 100 apps with a store record, so each chart holds 95 to 100 apps. In total the study covers 4,756 distinct apps: 2,395 from the free charts and 2,361 from the paid charts.
The main measure is the field Apple calls currentVersionReleaseDate: the date and time the app's current version was released on the store. For each app we counted the days from that moment to the snapshot. We also kept the app's first release date, its version number, its rating and number of ratings, its size, the minimum iOS version it needs, the number of languages on its product page, and two facts about its release notes: their length, and whether the whole text is a stock phrase. We did not keep the release note text itself.
Every number on this page comes from one script run against one saved snapshot, so the results can be reproduced, and the same method can be run on any other day. Ratings, sizes and versions are Apple's own values as the API returned them. Where we grouped apps, the size of each group is given next to its result, because a median of 24 apps deserves less trust than a median of 2,395.
Why Days Since the Last Update Says a Lot About Release Cadence
A single snapshot does not count updates. It tells you, for each app, how long ago its current version came out. To count how many versions an app ships in a year, you would have to watch it every day for a year. So it is fair to ask whether days since the last update says anything about how often apps update.
It says more than it seems, for a simple reason. An app that ships every 7 days can never be more than 7 days past its last release. Check it on a random day and its last update is somewhere between 0 and 7 days old, 3.5 days on average. An app that ships every 30 days will be somewhere between 0 and 30 days, 15 on average. For an app on a steady schedule, days since the last update is about half the gap between its releases. Across thousands of apps, the luck of the day you look evens out, so the median for a group reflects how often that group ships.
Alex is a made up example. Alex's habit tracker ships every two weeks, on a Monday. On the Tuesday after a release, the app is 1 day past its last update. On the Friday of the second week, it is 11 days past. Over a full cycle it averages 7 days, half of its 14 day rhythm. If 200 apps all worked like Alex's, their median days since the last update would be close to 7. Read the same way, a median of 6.9 days for the top free apps fits a typical rhythm of one to two weeks, which matches what large teams say about their own schedules further down this page.
Some readings need no interpretation at all. If an app's current version is more than a year old, the app has not shipped an update in more than a year. That makes the over a year share, 2.1% of top free apps and 36.0% of top paid apps, an exact count, not an estimate. The within 7 days and within 30 days shares are exact too, as statements about the past week and the past month. They only become estimates when you read them as a habit: one release this week does not prove a weekly schedule, and a long gap can be a pause rather than a policy.
Update Recency by Chart: Top Free, Top Paid and Category Top 10
The same split in numbers, with quartiles. The 25th percentile is the point a quarter of apps are below, and the 75th percentile the point three quarters are below. All values except the shares are days since the last update.
| Group | Apps | Median | 25th percentile | 75th percentile | Within 7 days | Within 30 days | Within 90 days | Over a year |
|---|---|---|---|---|---|---|---|---|
| All chart apps | 4,756 | 19.1 | 5.1 | 186.9 | 32.8% | 56.3% | 69.2% | 18.9% |
| Top free apps | 2,395 | 6.9 | 3.7 | 18.6 | 50.5% | 83.4% | 94.2% | 2.1% |
| Top paid apps | 2,361 | 151.1 | 21.2 | 901.1 | 14.8% | 28.9% | 43.9% | 36.0% |
| Apps in a category top 10, free and paid | 480 | 6.8 | 3.5 | 37.6 | 50.8% | 72.9% | 81.5% | 9.6% |
| Top 10 free apps in each category | 240 | 4.6 | 1.3 | 7.7 | 72.9% | 95.0% | 98.3% | 0.8% |
| Top 10 paid apps in each category | 240 | 28.8 | 5.4 | 199.2 | 28.8% | 50.8% | 64.6% | 18.3% |
Not updated in over two years: 1.0% of top free apps and 27.4% of top paid apps. The two top 10 rows split by chart are our extra cut from the same snapshot.
Why Top Paid Apps Update So Much Less Often
The paid charts are not a smaller copy of the free charts. They hold a different kind of app. The median top paid app had 40 ratings, and 83.1% had fewer than 1,000. All 268 apps in our data with a million ratings or more came from the free charts, and of the 268 apps with no ratings at all, 262 were paid. Those numbers suggest that a modest number of sales can keep a paid app in a category's top 100, although Apple does not publish how its charts are ranked.
Paid chart apps are also older. The median top paid app first came out 9.1 years before the snapshot, against 7.2 years for the median top free app, and 45.6% of paid chart apps were 10 years old or more. Many are one time purchases: the median price was $3.99, and $0.99 was the most common price. An app that earns once per customer has less reason, and often less budget, to ship every week than a free app that earns from subscriptions, ads or in app purchases.
The business model shows up even when size is held constant. In every ratings tier that holds both kinds of app, paid apps had updated less recently than free ones: a median of 41.7 days against 6.6 for apps with 10,000 to 100,000 ratings, 91.9 against 11.9 for apps with 1,000 to 10,000, and 167.0 against 12.6 for apps with fewer than 1,000. Our data cannot say why, but it rules out the idea that paid apps are slow only because they are small.
The result is a long tail of apps that still sell but rarely change. 22.5% of top paid apps were on a version more than three years old, and 14.6% on one more than five years old. The oldest current version in the paid charts dated from June 2009. Apple's App Store Improvements process flags apps that have not been updated within the last three years and also fail a minimal download threshold, which Apple describes as not downloaded at all or extremely few times in a rolling 12 month period. An app selling well enough to chart is unlikely to fail the second test, so these apps stay listed.
Some paid apps are the opposite. The number 1 paid app in each category had a median of 7.3 days since its last update, and the top 10 paid apps per category a median of 28.8 days. Below rank 50 the paid median rose to 215.8 days. Among well known paid games, Minecraft, the number 1 paid game, was 28.8 days past its last update, while Five Nights at Freddy's, at number 12, was still on a version released on March 7, 2024.
Apps at the Top of Their Category Update Fastest
Rank and update pace go together in the free charts too. The number 1 free app in each of the 24 categories had a median of 4.0 days since its last update, and 79.2% of those 24 apps had updated within the past week. Across the top 10 free apps per category, 240 apps, the median was 4.6 days and 95.0% had updated within 30 days. From rank 11 to 50 the median was 6.7 days, and from rank 51 to 100 it was 8.2 days.
That is a correlation, and it probably runs in both directions. Many apps at the top belong to large companies, several of which describe weekly release trains, and those teams can afford to ship often because the app already earns. Nothing in this data shows that shipping more often moves an app up a chart. What the data does show is the standard you are measured against: if you compete for the top 10 of a free category, most of your neighbors shipped something in the past week.
Taken together, the 480 apps in a category top 10 had a median of 6.8 days, but a wider spread than the free top 10 alone. 9.6% of them had not updated in a year, and 44 of those 46 apps were paid apps at the top of quiet paid charts. For the wider picture of how many apps and developers compete in the store, see our App Store statistics.
App Update Frequency by Category
The median days since the last update for each of the 24 categories, free and paid apps together. The spread is real, but it is narrower than the gap between free and paid.
How Often Apps Update in Each Category
The full table, sorted by the median for all chart apps. The free and paid columns split each category into its two charts of about 100 apps each, which shows where the category gaps come from.
| Category | All apps, median days | Top free, median days | Top paid, median days | All apps, updated within 30 days | All apps, not updated in a year |
|---|---|---|---|---|---|
| Games | 11.2 | 5.6 | 101.6 | 65.2% | 20.2% |
| Productivity | 11.3 | 4.6 | 97.7 | 63.1% | 17.2% |
| Health & Fitness | 11.9 | 5.7 | 79.6 | 61.5% | 13.3% |
| Travel | 12.6 | 5.9 | 190.9 | 61.0% | 19.0% |
| Lifestyle | 12.7 | 6.5 | 156.7 | 60.1% | 19.2% |
| Music | 12.9 | 9.8 | 19.9 | 63.8% | 13.6% |
| Finance | 13.5 | 5.0 | 89.7 | 61.8% | 12.6% |
| Entertainment | 15.0 | 6.8 | 292.7 | 58.8% | 23.6% |
| Shopping | 15.6 | 5.7 | 990.9 | 55.1% | 29.3% |
| Photo & Video | 16.4 | 6.3 | 55.2 | 60.8% | 10.6% |
| Utilities | 18.0 | 8.2 | 31.8 | 64.1% | 11.1% |
| Business | 18.9 | 5.8 | 195.6 | 54.8% | 19.1% |
| Weather | 21.0 | 8.2 | 45.5 | 55.1% | 18.2% |
| Food & Drink | 21.0 | 7.4 | 844.9 | 54.0% | 31.0% |
| Education | 22.1 | 5.5 | 151.9 | 55.1% | 18.7% |
| Social Networking | 24.7 | 5.6 | 492.9 | 54.8% | 27.6% |
| Sports | 24.8 | 8.1 | 161.7 | 52.8% | 18.6% |
| Books | 24.9 | 10.8 | 242.0 | 53.0% | 16.7% |
| Graphics & Design | 24.9 | 11.1 | 78.5 | 53.5% | 13.5% |
| Navigation | 26.0 | 14.7 | 84.0 | 54.4% | 13.3% |
| News | 29.6 | 6.6 | 305.5 | 50.0% | 23.2% |
| Reference | 30.6 | 9.5 | 199.0 | 49.7% | 21.6% |
| Medical | 39.9 | 14.9 | 208.7 | 46.4% | 21.4% |
| Developer Tools | 41.9 | 20.0 | 102.5 | 43.5% | 22.0% |
Each category holds 194 to 200 apps. The free and paid medians are our extra cut from the same snapshot; each rests on 95 to 100 apps, so a single app moves them more than it moves the combined median.
What the Category Numbers Say
Free apps update fast in every category. The top free median ran from 4.6 days in Productivity to 20.0 days in Developer Tools, and in 21 of the 24 categories it was under 12 days. The categories pull apart mostly because of their paid charts, which ran from a median of 19.9 days in Music to 990.9 days in Shopping. A category's place in the ranking says as much about the paid apps people buy in it as about how often its apps change.
Games sit at the top. Top free games had a median of 5.6 days since their last update, and 94.0% had updated within 30 days, which fits games that run regular events and new content. The paid game chart was split between titles that ship every few weeks and older games that have not changed in years, with a median of 101.6 days. For the business side of games, our mobile game market statistics and the guide to mobile game marketing go further.
Productivity, Finance, Travel and Health & Fitness have free charts led by large companies: Microsoft's and Google's office apps, payment and trading apps like PayPal, Venmo and Robinhood, booking apps like Airbnb and Expedia, and fitness apps like Strava and MyFitnessPal. Finance, Shopping and Food & Drink had the highest share of free apps updated within 30 days, 96.0% each.
At the slow end, Developer Tools stands out even in its free chart. Its median free app had fewer than 200 ratings, a category of small tools that ship when there is something to ship, and its free median was 20.0 days, the slowest of all. Medical is different: its free apps are not small, with a median of 43,293 ratings, yet the free median was 14.9 days, the second slowest. Testing and compliance work in health software may explain part of that, though our data cannot say. Navigation follows at 14.7 days. In News, Reference and Food & Drink, the combined median is pulled up by paid charts full of old apps; the top paid Food & Drink median was 844.9 days.
If you want one benchmark for your category, use the top free column, because it reflects what the apps competing for downloads actually do. If your app is paid, the top paid column shows how wide the range of normal is.
iOS App Update Frequency by App Size
We used the number of ratings as a stand in for an app's size, because Apple does not publish download counts. The tiers count the ratings shown in the US store. The last column repeats the median for top free apps only, to separate size from the free and paid split.
| Ratings in the US store | Apps | Median days | Within 7 days | Within 30 days | Over a year | Top free only, median days |
|---|---|---|---|---|---|---|
| 1 million or more | 268 | 4.9 | 70.5% | 96.6% | 0.7% | 4.9 |
| 100,000 to 1 million | 694 | 6.1 | 54.2% | 90.9% | 0.6% | 6.1 |
| 10,000 to 100,000 | 828 | 7.3 | 49.0% | 79.2% | 4.7% | 6.6 |
| 1,000 to 10,000 | 672 | 20.8 | 30.1% | 55.8% | 17.3% | 11.9 |
| Fewer than 1,000 | 2,294 | 99.8 | 16.8% | 33.1% | 32.3% | 12.6 |
The top free column covers 268, 685, 739, 371 and 332 apps from the top row down. Most apps with fewer than 1,000 ratings came from the paid charts: 1,962 of the 2,294.
Bigger Apps Ship More Often, Even in the Free Charts
The more ratings an app has, the more recently it was updated. Apps with a million ratings or more had a median of 4.9 days since their last update. A quarter of them had updated within 1.1 days, 70.5% within a week and 96.6% within the past month. Only 9 of those 268 apps had gone more than 30 days.
Part of the jump at the small end is the free and paid split again, since most small apps in our data are paid. But the pattern holds inside the free charts alone. The median rose from 4.9 days for the largest free apps to 6.6 days for free apps with 10,000 to 100,000 ratings, 11.9 days for those with 1,000 to 10,000, and 12.6 days for those with fewer than 1,000. Small free apps sat about two and a half times further from their last update than the largest ones.
That matches how teams describe their work. A large app has many teams adding features at once, so it needs a fixed release train to merge them safely, and the train leaves every week whether or not any single feature is ready. A solo developer ships when a feature is done. Neither is wrong. Using the rule of thumb above, a median of about 12 days fits a release every three to four weeks, so a small team on that rhythm is in line with the small free apps in the charts, and nothing in the data says it has to match a company with hundreds of engineers.
Do Older Apps Update Less Often?
We grouped apps by the date of their first release. New apps update the most, and the pace settles after about six years.
| App age at the snapshot | Apps | Median days since update | Within 30 days | Over a year |
|---|---|---|---|---|
| Under 1 year | 816 | 12.2 | 67.9% | 0.0% |
| 1 to 3 years | 514 | 14.9 | 61.5% | 10.7% |
| 3 to 6 years | 606 | 16.4 | 59.1% | 16.7% |
| 6 to 10 years | 889 | 26.9 | 51.4% | 23.4% |
| 10 years or more | 1,931 | 26.8 | 51.5% | 27.8% |
An app under a year old cannot have gone a year without an update, so its last column is zero by definition. 157 apps, 3.3%, had a current version dated the same day as their first release, which usually means no update since launch; 146 of them were paid.
Does Updating Often Lead to Better Ratings?
Only a little, as far as this data can show, and it cannot show cause. Among apps with at least 100 ratings, those updated within the past 30 days had a median rating of 4.7 stars. Those last updated 31 to 365 days earlier had a median of 4.6, and so did those not updated in over a year. The medians sit close together because App Store ratings bunch near the top of the scale.
The difference is clearer in the share of apps rated 4.5 stars or higher: 83.4% of recently updated apps, 64.4% of those updated 31 to 365 days earlier, and 57.7% of those not updated in a year. The same order holds inside the free charts and inside the paid charts, so it is not just the free and paid split showing up again. It is still a correlation. Teams that ship often tend to be larger and better funded, and a well rated app earns the money to keep shipping.
There is one more reason to read rating differences with care. Apple lets a developer reset the summary rating when releasing a new version, separately for each territory, and recommends using the feature sparingly. A reset changes the rating of exactly the apps that just updated. The same Apple page says an app can prompt for ratings up to three times in a 365 day period, and our guide on how to get App Store reviews covers when to ask.
Ratings by How Recently the App Was Updated
Apps with at least 100 ratings, 3,185 in all, grouped by the age of their current version. The last two columns repeat the 4.5 star share inside each chart type.
| Last update | Apps | Median rating | Mean rating | Rated 4.5 or higher | Top free, rated 4.5 or higher | Top paid, rated 4.5 or higher |
|---|---|---|---|---|---|---|
| Within 30 days | 2,185 | 4.7 | 4.63 | 83.4% | 85.6% | 68.9% |
| 31 to 365 days | 615 | 4.6 | 4.43 | 64.4% | 63.7% | 65.0% |
| Over a year | 385 | 4.6 | 4.38 | 57.7% | 56.5% | 57.8% |
The median ratings come from our main results. Mean ratings and the 4.5 star shares are our extra cut. The free row for apps not updated in a year rests on 46 apps, so treat it as rough.
What Day of the Week Do Apps Release Updates?
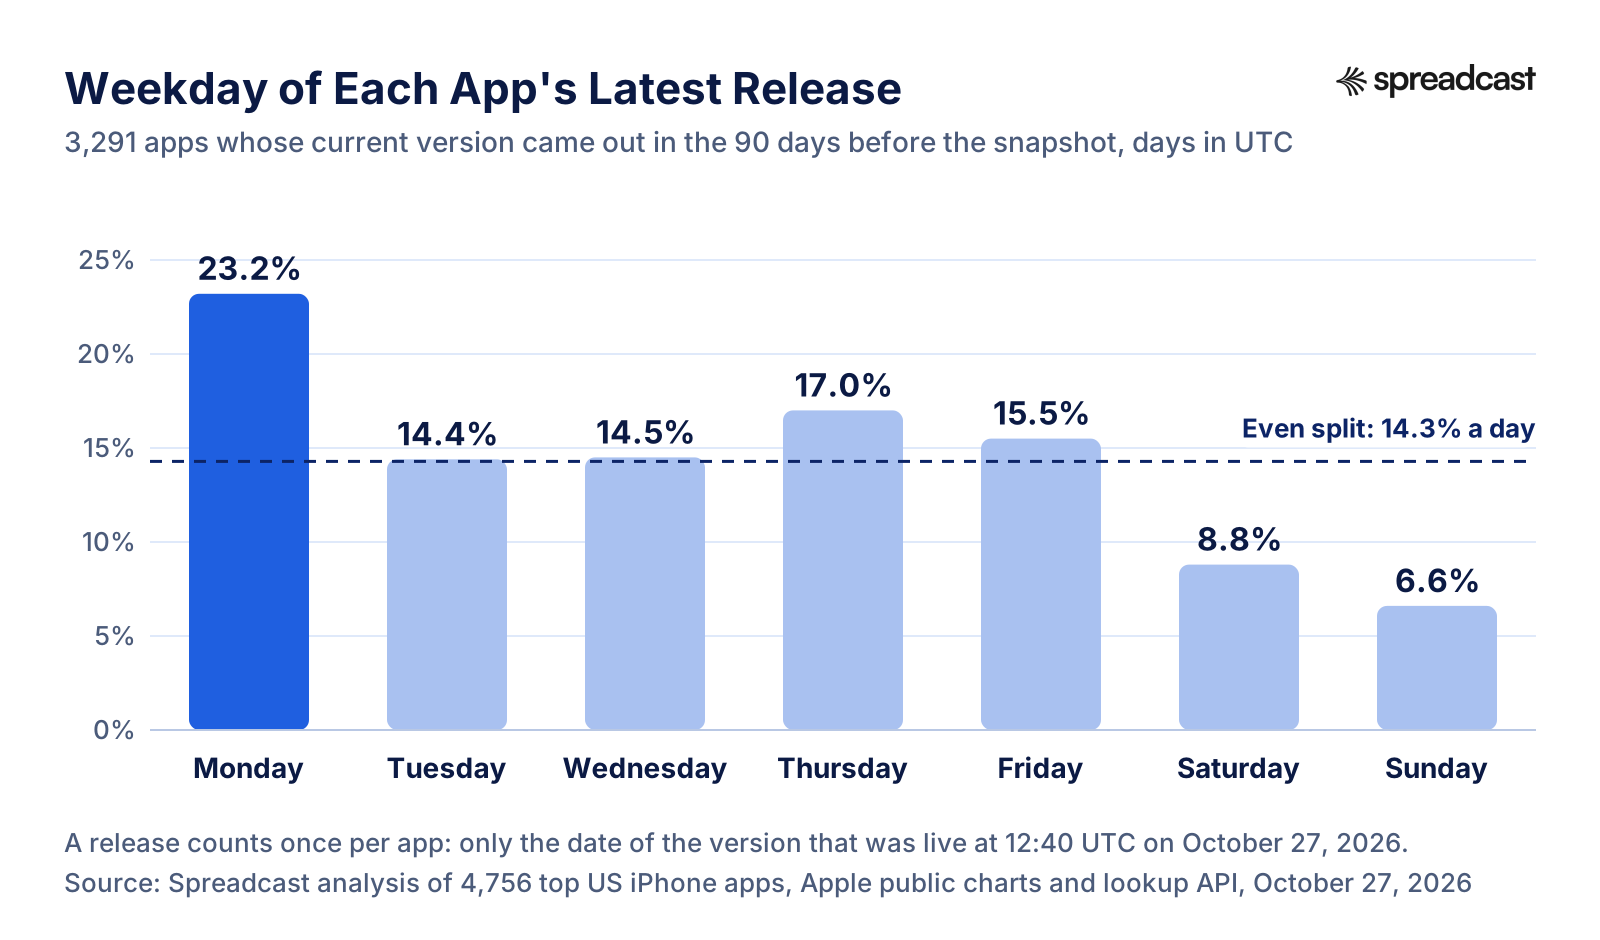
Monday is the busiest release day and the weekend the quietest. The chart counts the weekday of each app's current version, for the 3,291 apps updated in the 90 days before the snapshot.
Release Day Shares, With Three Checks
The snapshot ran on a Tuesday, and that matters. An app that ships several times a week shows Monday as its latest release, which lifts Monday. So we checked the result by dropping the most recent week, by switching to California time and by chart type.
| Day | All recent releases, UTC | Releases 7 to 90 days old, UTC | All recent releases, Pacific time | Top free apps, UTC | Top paid apps, UTC |
|---|---|---|---|---|---|
| Monday | 23.2% | 21.1% | 23.4% | 26.0% | 17.0% |
| Tuesday | 14.4% | 16.4% | 12.1% | 14.8% | 13.7% |
| Wednesday | 14.5% | 15.1% | 15.7% | 14.7% | 14.1% |
| Thursday | 17.0% | 17.5% | 17.9% | 17.4% | 15.9% |
| Friday | 15.5% | 14.4% | 14.0% | 14.9% | 16.6% |
| Saturday | 8.8% | 8.8% | 8.0% | 7.7% | 11.4% |
| Sunday | 6.6% | 6.7% | 9.0% | 4.5% | 11.3% |
Apps in each column, left to right: 3,291, 1,732, 3,291, 2,255 and 1,036. Pacific time is California time, which was on daylight saving time for the whole window. Only the first column is in our main results; the others are extra cuts.
Why Monday Leads
Dropping the most recent week removes the snapshot effect, and Monday still leads with 21.1% of releases, against 6.7% on Sunday. In California time it leads with 23.4%. The largest apps lean on Monday the hardest: among apps with 100,000 ratings or more, 33.9% of recent releases came out on a Monday and 2.9% on a Sunday. Top paid apps spread their releases more evenly and ship more on weekends, 11.4% on Saturdays and 11.3% on Sundays.
The engineering write ups of app teams describe a rhythm that produces exactly this. Thoughtworks describes a weekly loop in which the team submits the build for review on Friday, approval typically arrives by Monday, and the release decision is made then. Squarespace's Unfold team submits for store review on Friday and starts its staged rollout on Monday morning. Spotify's release process differs by a day: it aims to submit on Monday and rolls out over the following two days.
Apple's review times make the weekend a natural buffer. Apple's App Review page says App Review works around the clock and typically reviews at least 50% of submissions in less than 24 hours and 90% in less than 48 hours. A build sent on Friday is usually approved over the weekend, and a team that set the version to release manually can then release it on Monday with everyone at work. For the full breakdown of waits, see our page on App Store review time.
What Time of Day Do App Updates Go Live?
The release time follows the American working day. Between 15:00 and 18:59 UTC, which is 8 am to noon in California during daylight saving time, apps released 26.7% of their recent versions, against 16.7% for any four hours if releases were spread evenly. The wider window from 13:00 to 20:59 UTC held 47.4%. The quietest hours were 04:00 and 05:00 UTC, about 9 to 11 pm in California, at 1.7% each.
These are the times the versions went live on the store, which is not always when a person pressed a button. Apple's page on version release options offers three choices: release the version manually, release it automatically after approval, or release it automatically after approval but no earlier than a date and time you enter. Apple adds that a manually released version may take up to 24 hours to appear on the App Store. An automatic release follows the review clock rather than the developer's, so part of the hourly pattern belongs to Apple.
Best Day of the Week to Ship an App Update
No weekday makes an update more successful, and our data cannot measure success. What it shows is when others ship, and Apple's documentation shows how the release machinery works. A few practical rules follow from the two.
Submit Early in the Week if You Release Manually
With at least half of submissions reviewed within 24 hours and 90% within 48, a build sent on Monday or Tuesday is usually approved by midweek, which leaves time to fix a rejection before the weekend. Set the version to release manually and release it when you are ready to watch.
Release When Someone Can Watch the First Days
Phased release starts with 1% of users with automatic updates on day 1 and reaches 100% on day 7. The first two days are when a crash shows up at small scale. A Friday evening release puts those days on the weekend.
A Busy Monday Is Still a Good Monday
23.2% of recent releases in our snapshot came out on a Monday. Users never see a release day; they see the update when their phone installs it. Pick the day that fits your team's week, even if everyone else picked it too.
Keep Weekends for Small Fixes
Saturday and Sunday carried 15.4% of recent releases between them. A weekend release is fine for a small fix, but a bigger change is easier to support on a weekday, when the people who built it are around.
Time the Announcement to the Release, Not the Review
Review time varies, so schedule social posts and emails for the moment the version is live. With a scheduled release in App Store Connect, the announcement can be planned to the same hour. Our app update announcement examples show how other teams word it.
Put Events and Launches on Their Own Clock
Apple's App Review page says In App Events, custom product pages and product page tests can be submitted without a new app version. If a date is fixed, get the event approved early rather than holding a release for it. Our guide to In App Events covers the setup.
What Top Apps Put in Their Release Notes, in Numbers
Release notes are the text shown under the version number on the product page. We kept only two facts about them: how long they are, and whether the entire text is a stock phrase such as “Bug fixes and performance improvements”. The check is strict. It only flags notes whose whole text, after trimming spaces, matches one of a short list of stock phrases, so notes that start with a stock phrase and add one more line are not counted. The real share of uninformative notes is likely higher than our figure.
With that caveat: 3.5% of the apps had empty release notes, and 6.9% of the apps with notes used only a stock phrase. The median note ran to 104 characters, about one or two short sentences, and a quarter of notes were longer than 249 characters. 30.5% were shorter than 50 characters.
Large apps were more likely to use a stock phrase: 8.6% of apps with a million ratings or more and 9.5% of those with 100,000 to a million, against 4.7% of apps with fewer than 1,000 ratings. Top free apps used one in 9.4% of cases and top paid apps in 4.1%. That fits a weekly train, where many weeks carry only fixes. Apple's App Review Guidelines, last updated October 16, 2026, allow it: guideline 2.3.12 says simple bug fixes, security updates and performance improvements may rely on a generic description, but more significant changes must be listed in the notes.
Paid apps were more likely to leave the field empty, 6.6% against 0.4% of free apps. Recently updated apps wrote longer notes: a median of 133 characters for apps updated within 30 days, against 70 for apps not updated in a year. For what useful notes look like, see our app release notes examples, and to draft one from a list of changes, try the app release notes generator.
Version Numbers, Minimum iOS, Languages and Size
The same store records describe how apps number their versions, which iPhones they still support and how many languages they offer. All shares are of the 4,756 apps.
| Measure | Result | What it means |
|---|---|---|
| Median major version number | 3 | The first number in the version, such as 3 in 3.4.1. Top free apps had a median of 4 and top paid apps 2. |
| Major version 10 or higher | 16.3% | Apps that raise the first number often, such as Instagram at 453.0 and Strava at 487.0.0. |
| Major version 0 or 1 | 31.4% | Apps whose first number has never reached 2. |
| Version number contains a year | 2.2% | Date based numbers such as Robinhood's 2026.43.1 and ChatGPT's 1.2026.286. |
| Still on version 1, 1.0 or 1.0.0 | 2.8% | Apps on their first version number. |
| Requires iOS 13 or later | 86.6% | 13.4% still accept iPhones on iOS 12 or older. |
| Requires iOS 15 or later | 76.5% | iOS 15 is the most common minimum, set by 29.7% of apps. |
| Requires iOS 17 or later | 31.0% | About a third of top apps have dropped iOS 16. |
| Requires iOS 18 or later | 13.9% | Apps that run only on iOS 18, iOS 26 and iOS 27, since Apple's numbering went from 18 to 26. |
| Requires iOS 26 or later | 3.6% | Including 0.3% that require iOS 27. |
| Product page lists one language or none | 51.2% | 39.5% of top free apps and 63.1% of top paid apps. |
| Ten languages or more | 26.7% | 37.1% of top free apps and 16.2% of top paid apps. |
| Thirty languages or more | 6.6% | 313 apps, 258 of them from the free charts. |
| Median app size | 94 MB | Top free 171.4 MB, top paid 34.3 MB. 6.1% of apps were larger than 500 MB. |
Sizes use Apple's fileSizeBytes value, counted in megabytes of 1,000,000 bytes. Languages are the ones Apple's record lists for the app; 1.0% of apps listed none.
What the Version Numbers and Requirements Show
Version numbers carry a team's release history. Apple's documentation for the version string asks for three period separated integers in the form major, minor and patch, but leaves the meaning to the developer. Most apps use it the classic way, which is why the median major version is 3. A minority raise the first number very often: Instagram and Threads were both on 453.0 on the day of the snapshot, and Facebook on 584.1. Others put the date in, like Robinhood's 2026.43.1 and Reddit's 2026.43.0. For an app that raises the first number with each release, a version number in the hundreds is a record of hundreds of releases.
Minimum iOS versions show how far back apps support older iPhones. Apple's usage figures, measured on devices that transacted on the App Store on June 7, 2026, put 79% of all iPhones on iOS 26 and 14% on iOS 18, which leaves about 7% on older versions (derived). 13.9% of the apps in our snapshot required iOS 18 or later and only 3.6% required iOS 26 or later, so most top apps still run on phones that are several versions behind.
Apple's rules also force updates over time. Its upcoming requirements page says that since April 28, 2026, apps uploaded to App Store Connect must be built with Xcode 26 or later using an iOS 26 SDK, and that since September 9, 2026, iOS and iPadOS apps uploaded must target iOS 13 or later. In our data, none of the 2,986 apps whose current version came out on or after September 9 accepted anything older than iOS 13, a useful check that the records line up with Apple's rules. 47.0% of top paid apps, against 3.8% of top free apps, were still on a version released before the April 28 SDK date.
Languages are where top apps leave the most room. Half of all chart apps list one language or none in their store record, and even among top free apps 39.5% list only one. The App Store itself can show localized product page text in 50 languages and locales. For a small team looking for an update that new users will notice, a translation is one of the few changes that opens a new market instead of polishing the current one.
Latest Versions of Well Known Apps on October 27, 2026
A handful of familiar apps from the snapshot, to make the medians concrete. Days are counted to 12:40 UTC on October 27, 2026, a Tuesday, and release dates are in UTC.
| App | Chart and rank | Version | Released | Days before the snapshot |
|---|---|---|---|---|
| Photo & Video, free, number 2 | 453.0 | Monday, October 26, 2026 | 1.0 | |
| WhatsApp Messenger | Social Networking, free, number 2 | 26.42.74 | Monday, October 26, 2026 | 1.0 |
| TikTok | Entertainment, free, number 7 | 47.5.0 | Monday, October 26, 2026 | 0.6 |
| Duolingo | Education, free, number 1 | 7.146.0 | Monday, October 26, 2026 | 0.8 |
| Spotify | Music, free, number 1 | 9.1.94 | Friday, October 23, 2026 | 3.8 |
| Google Maps | Navigation, free, number 1 | 26.43.1 | Friday, October 23, 2026 | 4.2 |
| ChatGPT | Productivity, free, number 2 | 1.2026.286 | Thursday, October 22, 2026 | 4.6 |
| YouTube | Photo & Video, free, number 3 | 21.42.4 | Wednesday, October 21, 2026 | 5.6 |
| Minecraft | Games, paid, number 1 | 26.52 | Monday, September 28, 2026 | 28.8 |
| Stardew Valley | Games, paid, number 8 | 1.6.15.1 | Thursday, March 19, 2026 | 222.5 |
Versions and dates as Apple's lookup returned them for the US store. A big app's date is the release of the version, not the day every user received it.
How Often Should You Update Your App?
Apple sets no frequency. Its App Review Guidelines say, in the section on minimum functionality, that even after an app has been approved you should update it to ensure it remains functional and engaging to new and existing customers, and that apps which stop working or offer a degraded experience may be removed at any time. The hard floor is the App Store Improvements process: three years without an update together with almost no downloads gets an app flagged, and the developer is asked to submit an update within 90 days.
Above that floor, the data gives three reference points. The typical top free app was 6.9 days past its last release, which fits a rhythm of one to two weeks. Small free apps in the charts, with fewer than 10,000 ratings, sat at 11.9 to 12.6 days, which fits roughly every three to four weeks. And the paid apps that stay current, the top 10 in each paid category, sat at 28.8 days, which fits a release every month or two. These cadence readings use the rule of thumb explained earlier, that days since the last update is about half the gap between releases.
For most small teams, a release every two to four weeks is a sound default. It is frequent enough that bug reports get answered within one cycle, that the version history on the product page never looks abandoned, and that you always have recent news to share. It is slow enough to test each build properly. Weekly releases make sense once several people commit code every day, because a fixed train keeps each release small. Going longer than a couple of months between releases is normal for finished paid apps, though in our data apps that went a year without an update were less likely to be rated 4.5 stars or higher, whatever the cause.
Ship when you have a reason. A fix is worth shipping as soon as it is tested. A visible change is worth pairing with new screenshots, an In App Event or an announcement. Apple's requirements also change what a new build must use, such as the move to the iOS 26 SDK in April 2026, so an app that waits a long time between releases may face extra work before it can ship again. For how releases fit into a marketing plan, see iOS app marketing, and for keeping the store listing in step with each version, our guide to App Store optimization.
How Often to Update by App Type and Stage
Reference points from the snapshot for different kinds of app. Each describes a typical pattern in the charts, not a target Apple sets.
New App in Its First Year
Apps under a year old had a median of 12.2 days since their last update, the fastest of any age group, and 67.9% had updated within 30 days. The first months are when reviews arrive and gaps show, so plan short cycles of two weeks or less. Our app launch checklist covers the first version.
Small Free App or Indie Project
Free chart apps with 1,000 to 10,000 ratings had a median of 11.9 days. A release every two to four weeks keeps you in line with them, and each release is a natural moment to ask happy users for a rating.
Large Consumer App
Apps with a million ratings or more had a median of 4.9 days, and 70.5% had shipped within a week. At this size a weekly release train is common, and a release is routine work rather than a project.
Free Game With Regular Content
Top free games had a median of 5.6 days. Events and content drops do not always need a new version: Apple's App Review page lists In App Events among the items you can submit without one.
Paid Utility or One Time Purchase
The top 10 paid apps in each category had a median of 28.8 days, and the paid charts as a whole 151.1. A paid app that works can go months between updates, but the next build after a long pause has to meet Apple's current SDK and minimum iOS rules.
Developer, Medical and Specialist Tools
Developer Tools and Medical had the slowest free medians, 20.0 and 14.9 days. Careful testing can justify a slower pace for features. Ship fixes promptly, and save new features for fewer, larger releases.
How to Set Up an App Release Schedule
A release schedule, often called a release train, means picking a cadence and letting each version leave on time with whatever is ready. These steps follow Apple's App Store Connect documentation and the release cycle large teams describe.
- Step 1
Pick a Cadence You Can Keep
Weekly suits a team with several engineers committing every day. Every two weeks suits most small teams. Runway's guide to release strategies says trains often run weekly or biweekly, and warns that a train which keeps waiting for late work loses the advantages of a strict schedule.
- Step 2
Fix the Cut Day
Choose the day the release branch is cut and keep it. Spotify starts each weekly cycle on a Friday. After the cut, only fixes for that release go in, and unfinished features stay hidden behind feature flags, as Mercari's mobile team describes for its own weekly schedule.
- Step 3
Test the Build With Real People
Send the release candidate to testers through TestFlight, which allows up to 100 internal testers from your team and up to 10,000 external testers. Builds for external testers are sent to App Review automatically once you add them to a group.
- Step 4
Submit With Time to Spare
Apple typically reviews at least 50% of submissions within 24 hours and 90% within 48 hours. Submitting two days before the planned release absorbs a normal wait. For a critical bug, Apple accepts requests for an expedited review, and asks for the steps to reproduce the bug.
- Step 5
Choose How the Version Goes Live
In App Store Connect, set the version to release manually, automatically after approval, or automatically after approval but no earlier than a date and time. Manual release gives you control of the day. Apple notes that a manually released version can take up to 24 hours to appear.
- Step 6
Roll Out in Phases and Watch
Turn on phased release to send the update to 1%, 2%, 5%, 10%, 20%, 50% and then 100% of users with automatic updates over 7 days. You can pause for up to 30 days in total, or release to all users at any time. Anyone can still download the update by hand during the rollout.
- Step 7
Announce It Where Users Look
About 1.5% of updates are installed by hand, so release notes reach few people. Post about the release on your social channels, email the users who asked for the change, and mention it inside the app.
Video: Apple on Building and Delivering Releases With Xcode Cloud
Apple's WWDC26 session on Xcode Cloud shows how to build and test each version and deliver it to TestFlight and the App Store automatically, which is the plumbing a regular release schedule rests on.

Release Trains at Large App Teams
The weekly rhythm of top apps is a deliberate choice, and some teams have written about it. Meta's engineering post Rapid release at massive scale, from August 31, 2017, says its mobile releases went from four week releases to two week releases to one week releases. Spotify's April 2025 post describes a weekly cadence in which less critical bugs and new features simply wait for the next release, and says its procedure rolls out more than 95% of releases to all users.
Smaller product teams have moved the same way. Squarespace's Unfold team went from shipping whenever new features were ready, sometimes four or five releases in a week, to a one week release train in which everyone takes a turn as release captain. Mercari follows a predictable weekly schedule, hides unfinished work behind feature flags and uses phased release, halting it if a hotfix is needed. Thoughtworks describes a weekly loop that fully releases on Wednesday when the crash rate stays below a set threshold, and keeps the interval within two weeks even when a feature misses the train.
The reasons repeat across these accounts. A fixed train keeps each release small, so a bad change is easy to find. It makes dates predictable, so marketing and support can plan around them; Runway's guide points out that feature based releases are hard to plan campaigns around. And it turns a stressful event into a routine. The cost is process: a train needs automated tests, a branch policy and someone to run it every week.
How often are apps updated by the biggest names? The table above answers it for a few: Instagram, WhatsApp, TikTok and Duolingo all shipped on the Monday before our snapshot. A train that leaves every week shows up in a snapshot exactly like that, as a cluster of releases a few days old.
Video: How Lyft Scaled Its Release Train
At Android Makers 2020, Lyft engineers Thomas Ezan and Helen Adekoya explained how the team kept releases steady while its Android team grew from 7 to 70 developers. The talk is about Android, but the release train, the cut off rules and the incident handling apply to iOS teams as well.

Phased Release and Review in Brief
Two parts of Apple's process shape any release schedule. The first is review. Apple's figures, at least 50% of submissions reviewed within 24 hours and 90% within 48, are typical times, and Apple says an incomplete submission can delay the review or fail it. Our page on App Store review time covers the waits in detail, and App Store rejection reasons covers what most often sends a build back.
The second is phased release. It only applies to users with automatic updates, a random sample of whom receive the update without being told they are part of a phased release. Apple's schedule runs 1% on day 1, 2% on day 2, 5% on day 3, 10% on day 4, 20% on day 5, 50% on day 6 and 100% on day 7. You can pause it for up to 30 days in total, with no limit on the number of pauses, and you can release the version to all users at any time once it is ready for distribution.
Neither step needs to slow a regular schedule down. Review usually fits inside a weekend, and a phased rollout overlaps with the next cycle's work. If your team is new to App Store releases, start with our page on the Apple Developer Program, the membership every App Store submission depends on.
Video: How Mobile App Releases Work
ByteByteGo's short animated explainer follows a mobile release from code to the app stores, a quick primer if you are setting up your first release process.

How Our Numbers Compare With Other Update Frequency Data
The best known public figures come from 42matters, which tracks the 1,000 App Store apps with the most ratings over time. On a page last updated October 25, 2026, it says 487 of those apps are updated every week, 790 every month and 979 every year, and it names Monday as the most popular day for releasing updates and Sunday as the least popular.
Our closest group is the 1,000 apps with the most ratings in our own snapshot, each with at least 90,950 ratings. 58.1% of them had updated within 7 days, 92.2% within 30 days and 99.4% within a year. Those shares sit above 42matters' figures. The likely reason is the population: every app in our study was in a current top 100 chart, so it was being actively run, while a list ranked by ratings volume can include apps that collected many ratings years ago. We cannot check that from outside. The direction is the same in both datasets: about half of the largest apps ship in any given week, nearly all ship within a year, and both put Monday first and Sunday last.
Apple's own data sets the scale: more than 46.6 billion automatic updates a week in the 2025 Transparency Report. Our App Store statistics page collects Apple's other published numbers, and our app retention benchmarks cover what happens to users after they install.
Limits of This Study
Read the numbers with these limits in mind. Each one narrows what the data can claim.
One Snapshot, Not a Count
We saw each app once, on October 27, 2026. Days since the last update describes recency. It reflects cadence for apps on a steady schedule, but it cannot count releases, and it cannot tell a weekly app from one that shipped once this week after a long pause.
Chart Apps Only
Every app was in a US top 100 chart for its category, which means people were downloading or buying it at the time. Apps outside the charts may update far less often, and this study says nothing about them.
The US Storefront Only
We read the US charts and the US store records. Ratings counts, chart ranks and release notes are those of the US store, and other countries may differ.
Paid Charts Include Long Running Apps
The paid charts hold many small and old apps that still sell. The paid figures describe the paid charts, not every paid app, which is why we report free and paid separately throughout.
Weekday and Hour Are in UTC and Recent Only
Release days and hours use UTC and only apps whose current version came out in the 90 days before the snapshot. Because the snapshot ran on a Tuesday, Monday is lifted a little; dropping the most recent week still puts Monday first at 21.1%.
A Strict Test for Stock Release Notes
Notes count as generic only when the entire text exactly matches one of a short list of stock phrases. Notes that add anything are not counted, so 6.9% is a floor for uninformative notes, not an estimate of them.
Correlation, Not Cause
Apps that update often have more ratings, higher chart ranks and a higher share of 4.5 star ratings. None of that shows that updating causes the rest. Large, well funded teams tend to do all of these things at once.
Apple's Values as Returned
We used Apple's lookup values as they came back, including ratings, sizes and dates. If Apple's record for an app is wrong or late, so is our row for it.
Download the Data
The aggregate tables behind this page, by chart, category, ratings count and app age, are free to download as a CSV file of the study results. The file holds group results only: the number of apps, the median and quartile days since the last update, and the shares updated within 7, 30, 90 and 365 days or not updated in over one or two years. We do not publish rows for individual apps or any release note text.
If you cite the study, please name Spreadcast, give the date of the snapshot, October 27, 2026, and link to this page. The weekday, release notes, ratings and version figures above come from the same snapshot and the same script.
Where Spreadcast Fits
The clearest pattern in this study is that popular apps ship all the time. Half of the top free apps released a version in the past week, and most of those releases install silently: Apple counts about 1.5% of updates as installed by hand. Each version is a small piece of news that almost nobody sees unless the team tells them.
Spreadcast is built for that moment. Paste your App Store link once at the start page, and Spreadcast checks your listing every day. When a new version ships, it designs a post about the update from your real app screenshots in an iPhone frame, in your brand colors and fonts, and writes a caption for each network. It also posts when the app reaches a rating milestone. Posts go to Instagram, TikTok, LinkedIn, Facebook, Threads, Pinterest, Bluesky, Mastodon, Telegram and Discord, plus YouTube for video posts, on full autopilot or with one tap approval.
It watches the App Store only, not Google Play, and we do not claim it changes your downloads or ratings by any number. What it changes is that a release every week or two becomes a post every week or two without anyone designing it. The free plan makes 3 posts for you to download, and Pro is $29 a month to publish to up to 10 social accounts, as shown on the pricing page. For other ideas between releases, see how to promote an app on social media.
Frequently Asked Questions
How often do apps update?
Popular iPhone apps update about every week or two. In our snapshot of 4,756 apps in Apple's US top charts on October 27, 2026, the median top free app had released its current version 6.9 days earlier and 83.4% had updated within 30 days. Top paid apps were much slower, with a median of 151.1 days.
How often do apps update automatically on iPhone?
Apple does not publish a schedule. Apps from the App Store update automatically by default, so your iPhone installs each new version some time after the developer releases it. How often that happens depends on the app: half of the top free apps in our data had released a version in the past week.
Why are my apps updating so often?
Because the most popular apps ship new versions every week or so, and automatic updates install each one. Apple's 2025 Transparency Report counts over 46.6 billion automatic app updates a week. To choose yourself, open Settings, tap Apps, tap App Store and turn off App Updates.
How often should you update your app?
Apple sets no frequency, but an app not updated in three years that is almost never downloaded can be flagged for removal. For a small team, a release every two to four weeks matches the small free apps in the charts, while large consumer apps ship weekly. Ship fixes once they are tested and pair visible changes with an announcement.
What is the best day to release an app update?
Monday is the most common release day in our data, with 23.2% of recent releases, and Sunday the least common at 6.6%. The best day is one when your team can watch the first days of a phased release. Several large teams describe submitting late in the week and releasing on Monday.
Do apps that update often have better ratings?
Slightly, and only as a correlation. Among apps with 100 or more ratings, those updated within 30 days had a median of 4.7 stars against 4.6 for apps not updated in a year, and 83.4% were rated 4.5 or higher against 57.7%.
Which app categories update most often?
Games, Productivity and Health & Fitness had the shortest medians in our snapshot, 11.2, 11.3 and 11.9 days. Developer Tools and Medical had the longest, 41.9 and 39.9 days. In every category, the top free apps had updated more recently than the top paid apps.
What is an app release train?
A release train is a fixed schedule: a new version leaves on a set day, usually every week or every two weeks, with whatever work is ready, and anything late waits for the next one. Meta, Spotify, Squarespace's Unfold team and Mercari all describe weekly trains.
How long does a phased release take on the App Store?
Seven days. Apple releases the update to 1%, 2%, 5%, 10%, 20%, 50% and then 100% of users with automatic updates, one step a day. You can pause for up to 30 days in total or release to everyone at any time.
Can I use the data from this study?
Yes. The aggregate tables are free to download as a CSV file from the Download the Data section of this page. They hold group results only, not rows for individual apps. Please credit Spreadcast and the snapshot date, October 27, 2026.
Where These Facts Come From
Every outside number, rule and price on this page links to the page it was taken from.
- How to manually update apps from the App Store (September 14, 2026)Apple Support
- Update apps from the App Store on iPhoneApple Support
- Change settings and restrictions in the App Store on iPhoneApple Support
- 2025 App Store Transparency ReportApple
- Top free iPhone apps feed, Games, United States (legacy iTunes RSS)Apple
- iTunes Search API: lookup requests by app IDApple Developer
- Release a version update in phasesApp Store Connect Help
- Select an App Store version release optionApp Store Connect Help
- App Review: review times and expedited reviewsApple Developer
- App Review Guidelines (updated October 16, 2026)Apple Developer
- App Store Improvements: apps not updated in three yearsApp Review Help
- Upcoming requirements: SDK and minimum iOS rulesApple Developer
- iOS and iPadOS usage, measured June 7, 2026Apple Developer
- Ratings, reviews and responsesApple Developer
- CFBundleShortVersionString: the release version numberApple Developer Documentation
- App Store localizationsApp Store Connect Help
- TestFlight: internal and external testersApple Developer
- App update frequency statistics for the top 1,000 iOS apps (updated October 25, 2026)42matters
- Rapid release at massive scale (August 31, 2017)Engineering at Meta
- A behind the scenes look at how we release the Spotify app, part 1 (April 17, 2025)Spotify Engineering
- Unfold's modern mobile release process (July 12, 2024)Squarespace Engineering
- How we deliver mobile app updates faster (October 22, 2025)Mercari Engineering
- How to release mobile apps weekly (December 16, 2022)Thoughtworks
- Mobile releases: feature based or release train (November 7, 2023)Runway
- Video: Build, deliver and automate with Xcode Cloud, WWDC26Apple Developer
- Video: How to scale your app release process, Lyft at Android Makers 2020Mobile Makers
- Video: Do you know how mobile apps are released?ByteByteGo
Researched and written by Spreadcast. Last checked on October 27, 2026.